Market SnapshotAs of 2026-07-21 09:07 ET (intraday change)
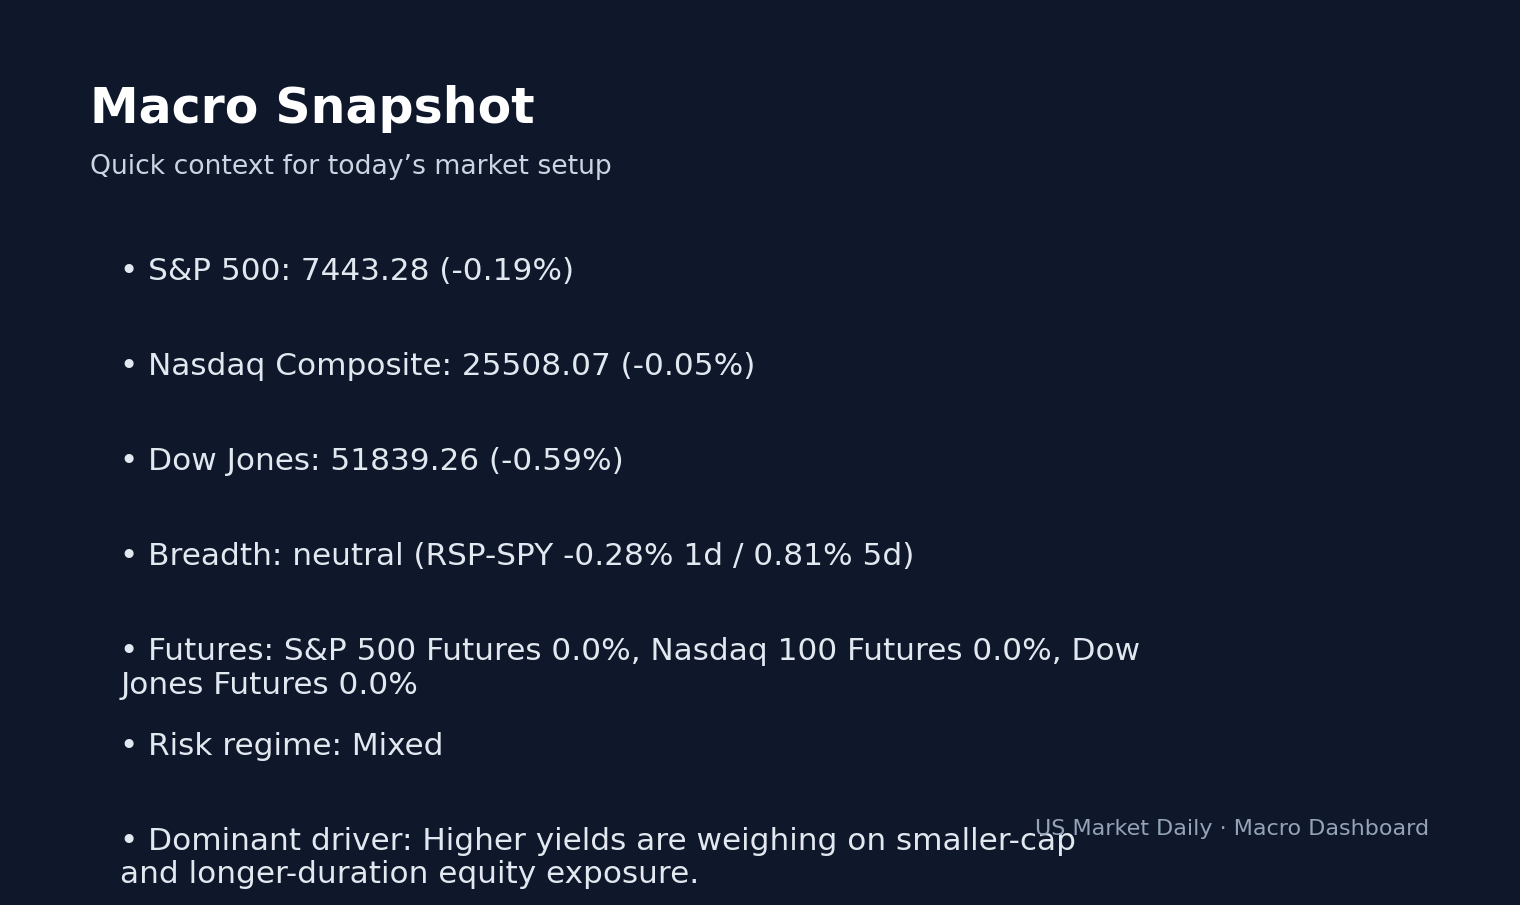
S&P 500
$742.09
▼ -0.16%
Nasdaq 100
$696.06
▲ +0.10%
Russell 2000
$292.31
▼ -0.59%
VIX
18.65
▼ -0.64%
US 20Y
$83.89
▼ -0.75%
Dollar
100.96
▲ +0.21%
Gold
$367.60
▼ -0.22%
273 bps is the number that matters for this week’s IPO tape: high-yield spreads sit in the 14th percentile, per FRED data, giving Southern Cross Acquisition I Corp. (NCOU) a risk-on window even though its offer price and estimated market cap are still listed as TBD per the July 21, 2026 IPO pipeline data.
This is not a crowded issuance week. The supplied July 21, 2026 IPO pipeline shows one listed deal: Southern Cross Acquisition I Corp. under the symbol NCOU, with the date set for 2026-07-21, sector tagged as Technology, and both the price range and estimated market capitalization marked TBD per the IPO pipeline data.
That missing price range matters more than usual. A normal operating-company IPO gives traders a revenue base, an indicated valuation, and a comparable-company frame. Here, the usable valuation anchor in the supplied data is the Technology sector peer price-to-sales median of 9.4x, per the pre-analyzed IPO data. Without NCOU revenue, offer size, price range, or estimated market cap in the prompt, the honest conclusion is narrow: NCOU can be evaluated as a calendar event and risk-appetite read, but not as a full fundamental valuation yet.
The tape is telling us that the market can absorb new risk. High-yield spreads at 273 bps, in the 14th percentile, signal a complacent or risk-on credit backdrop, per FRED data. The macro regime is labeled EXPANSION, per the supplied macro regime data. That combination usually lowers the hurdle for IPO demand because credit investors are not demanding stress compensation, equity volatility is not screaming for protection, and portfolio managers have more room to underwrite future cash flows.
But the clean macro backdrop does not solve the NCOU-specific problem. Price is still TBD. Estimated market cap is still TBD. Those are not small blanks; they are the blanks that decide whether a new issue is cheap enough to reward first-day buyers or merely well-timed enough to clear the book.
273 bps HY Spreads Say Demand Exists, Not That NCOU Is Cheap
High-yield spreads at 273 bps are the most important macro input for this week’s IPO Radar, per FRED data. At the 14th percentile, the credit market is not pricing a heavy default-risk premium. That matters for IPOs because new issues compete for the same risk budget that funds high-yield bonds, small-cap growth, and unprofitable technology stories.
The cause chain is straightforward. Tight HY spreads reflect easier credit risk appetite. Easier credit risk appetite lowers the penalty investors assign to uncertainty. Lower uncertainty penalties support higher equity multiples. Higher equity multiples make it easier for issuers to come public without resetting valuation expectations down. That is why an EXPANSION macro regime, per the supplied macro regime data, is supportive for IPO demand even when the company-specific data are incomplete.
There is a second signal from volatility. VIX is 18.65, VIX3M is 20.40, and VIX9D is 17.78, with the VIX term spread at +1.75, per yfinance and CBOE-listed options data. That is mild contango, not panic. A mildly upward-sloping VIX curve says traders are paying more for three-month protection than spot volatility, but they are not bidding near-term crash hedges aggressively.
The cross-asset bridge is important: HY spreads at 273 bps and a VIX term spread of +1.75 are telling the same story from different markets, per FRED data and yfinance/CBOE-listed options data. Credit is pricing low default fear, while equity options are pricing a neutral volatility regime. For IPOs, that is the difference between a market that demands a discount and a market that will at least listen to a new issue.
What stands out here is the asymmetry between market openness and deal transparency. The macro gate is open. The issuer-specific data are not. That is exactly where weak IPO work loses money: traders confuse a friendly window with a good entry price.
Southern Cross Acquisition I Corp. Has a 9.4x Sector Yardstick, but No Offer Price Yet
Southern Cross Acquisition I Corp. is listed in the Technology sector under ticker NCOU, with its IPO date shown as 2026-07-21, per the July 21 IPO pipeline data. The prompt does not provide operating description, revenue, profitability, cash flow, sponsor economics, redemption structure, use of proceeds, or lock-up terms. That missing data must stay visible inside the analysis because inventing it would create false precision.
What they do, based strictly on the supplied data: NCOU is an IPO candidate categorized as Technology. No further business model detail is provided in the prompt. That means readers should not assume it is software, semiconductors, infrastructure, fintech, cyber, artificial intelligence, or a special-purpose acquisition vehicle unless future filings or the deal roadshow say so. The only usable sector comparison supplied is the Technology peer P/S median of 9.4x, per the pre-analyzed IPO data.
Valuation against that 9.4x median is therefore conditional. If NCOU eventually prices at a revenue multiple below 9.4x, the market will have a clean argument that the deal is coming at a discount to the supplied peer group. If it prices above 9.4x, the burden shifts to growth quality, margin profile, balance-sheet strength, or scarcity value. Those details are not available in the supplied prompt, so the valuation call cannot be completed today.
The bear case is equally mechanical. A Technology-tagged IPO with a TBD price range and TBD market cap has no public valuation floor in this dataset. If the final range implies a premium to the 9.4x peer P/S median without supplied evidence of faster growth or better unit economics, the deal becomes a wait, not a chase. The risk is not that the sector is weak; the risk is that the market is strong enough to tolerate sloppy pricing.
The bull case is narrower but real. A single-name calendar can concentrate attention. In a risk-on regime with HY spreads at 273 bps, per FRED data, and SPX spot at 7443.28, per yfinance/CBOE-listed options data, allocators are not fighting broad-market stress. If NCOU prices at or below a valuation that is clearly discounted to the 9.4x Technology peer P/S median, the first-day setup improves because buyers can underwrite both macro demand and relative valuation.
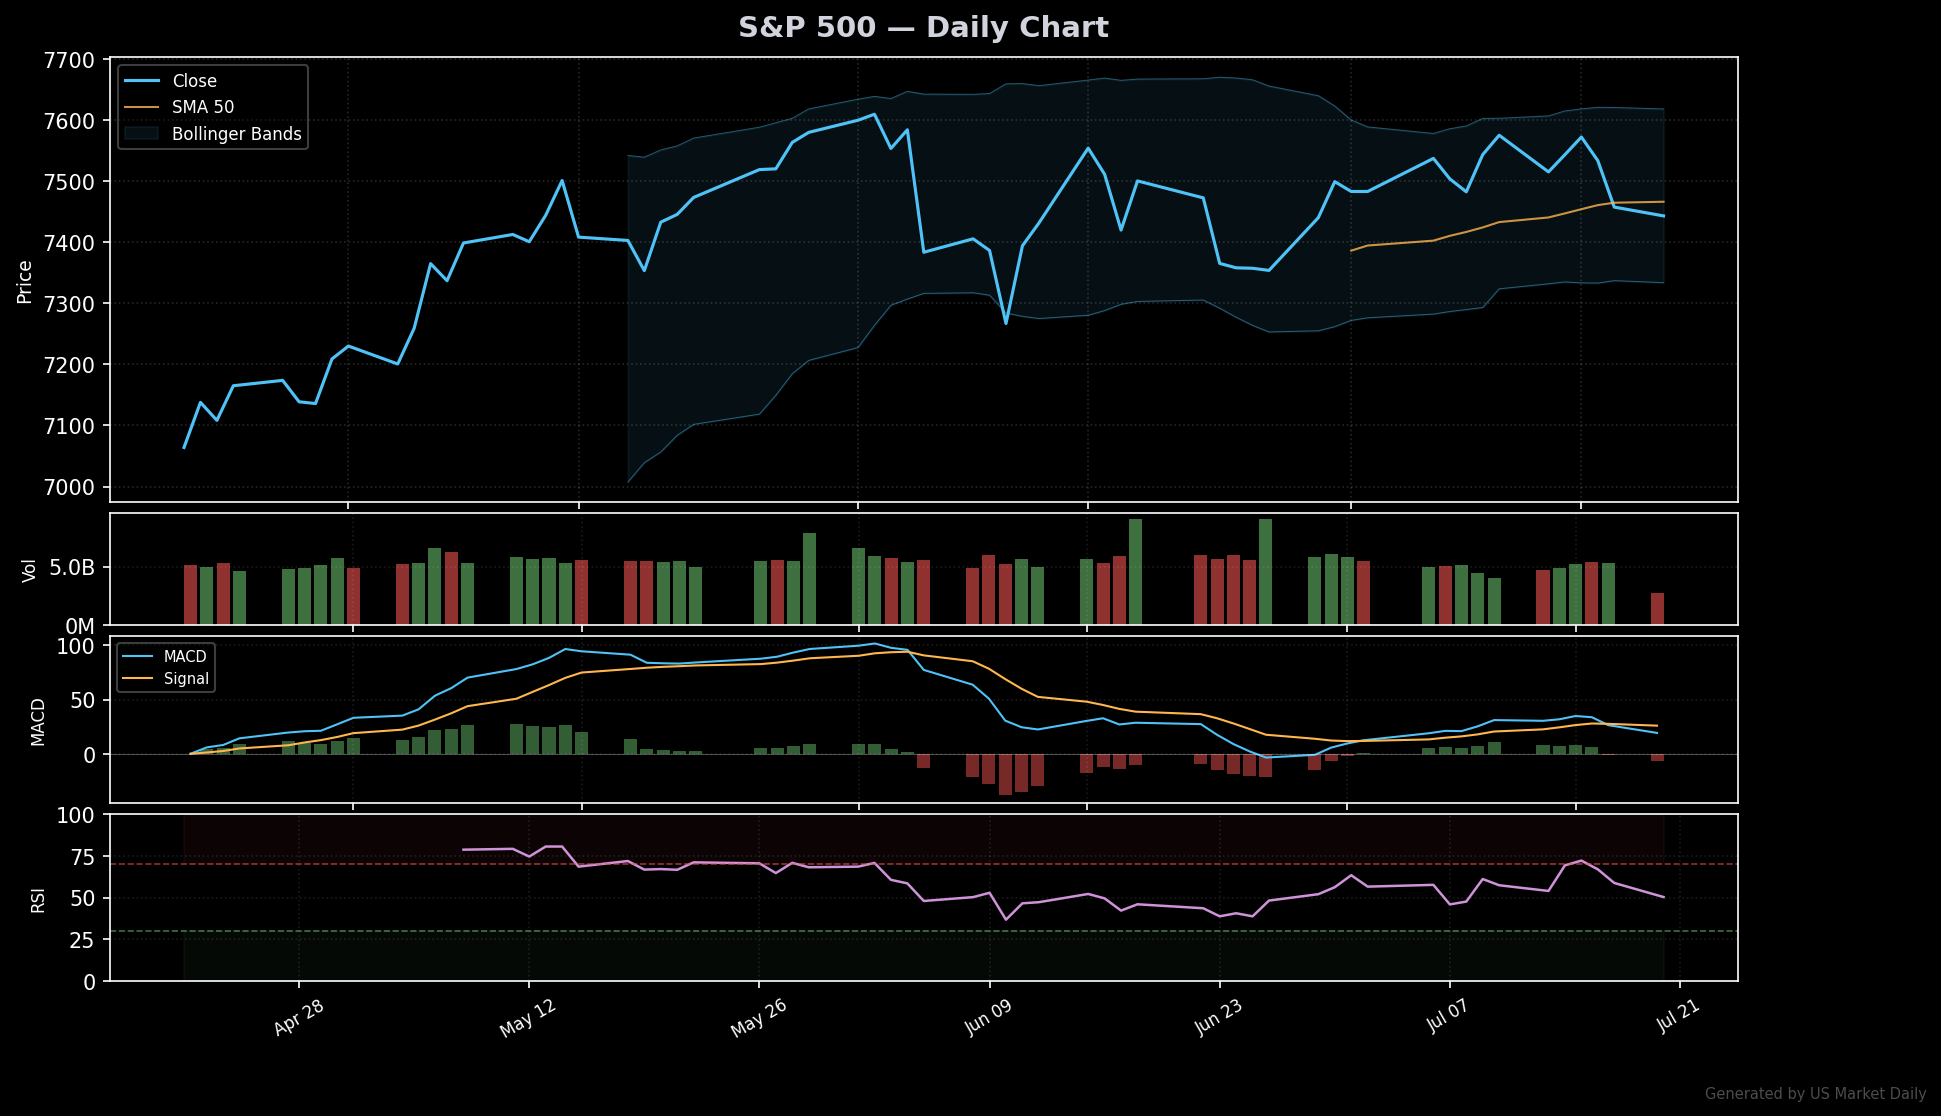
SPX 7443.28 and QQQ 696.06 Set the Volatility Budget
The equity market is not priced for a dead-calm month. SPX spot is 7443.28, and options imply a ±3.30% move over the next 30-day expiry, per yfinance/CBOE-listed options data. SPX near-term implied movement is ±1.70% over seven days, per the same options data. QQQ sits at 696.06, with options implying ±6.12% over the next 31 days, per yfinance/CBOE-listed options data.
That matters because Technology IPOs do not trade in a vacuum. A tech-labeled new issue enters a market where QQQ implied movement is nearly twice the SPX 30-day implied percentage move in the supplied data. The Nasdaq sleeve is carrying more expected movement, which can help first-day momentum if risk appetite stays open, but it also widens the gap between a clean IPO pop and a failed deal that gets hit as soon as buyers demand liquidity.
The overlooked signal: the volatility market is not hostile, but it is not free. VIX at 18.65 with VIX3M at 20.40 tells us protection is still priced into the forward curve, per yfinance/CBOE-listed options data. That is not the same as a speculative melt-up. For NCOU, the practical read is that price discipline still matters. A TBD price range can clear in this regime, but a rich final valuation will need immediate evidence that demand is real.
Counterintuitively, a one-deal IPO week can be less forgiving than a busier calendar. In a full slate, investors can rotate into the best relative setup. With only NCOU listed in the supplied pipeline, the market’s message is binary: either the deal becomes the week’s clean expression of new-issue risk appetite, or it exposes that IPO demand is selective even in an EXPANSION regime.
Where Consensus Is Wrong on a One-Deal IPO Week
The easy headline is that tight spreads and an expansion regime are good for IPOs. That is true as far as it goes. HY spreads at 273 bps and a 14th percentile reading are supportive, per FRED data. The supplied macro regime is EXPANSION, which reinforces the risk-on interpretation. But the consensus framing misses the more useful point: the market is not being asked to buy the IPO market this week. It is being asked to buy NCOU.
That distinction changes the work. Macro tells us whether the window is open. Deal terms tell us whether investors should walk through it. NCOU has the window. It does not yet have the terms in the supplied data. With price range and estimated market capitalization both marked TBD per the IPO pipeline data, the correct stance is not bullish or bearish. It is conditional.
What the tape is not pricing yet is the possibility that a friendly macro regime increases issuance quality dispersion. When risk appetite improves, more deals can come, but not every deal deserves the same multiple. A Technology peer P/S median of 9.4x, per the pre-analyzed IPO data, should be treated as a hurdle, not a blessing. The better trade is to make NCOU earn that multiple with terms, disclosure, and early trading behavior.
This is where first-day action matters. A strong opening that holds above the final offer price would show that demand exceeded allocation. A weak opening below the final offer price would tell us the book was not deep enough at the chosen valuation. The prompt does not provide the final offer price, so the watch level must be defined relative to that future number rather than invented in dollars.
NCOU Verdict: Wait Until the Price Range Clears the 9.4x Test
Verdict: wait. NCOU has the right macro backdrop but incomplete deal data. HY spreads at 273 bps support risk appetite, per FRED data, and the VIX term spread at +1.75 points to a neutral volatility regime, per yfinance/CBOE-listed options data. That is enough to keep NCOU on the radar. It is not enough to underwrite valuation.
The specific trigger is the final pricing relative to the Technology peer P/S median of 9.4x, per the pre-analyzed IPO data. If final terms imply a discount to 9.4x, NCOU moves from watch to actionable watchlist because buyers get macro support plus relative valuation support. If final terms imply a premium to 9.4x without supplied evidence of superior revenue growth, margin quality, or balance-sheet strength, the better verdict is avoid the first print.
For traders, the first tradable level is the final IPO offer price once disclosed. Because the supplied data list price as TBD, the article cannot name a dollar level without inventing one. The clean framework is relative: hold above the offer price after opening equals confirmed demand; break below the offer price equals failed new-issue sponsorship.
3 Scenarios From Here
Bull: NCOU prices at a valuation below the 9.4x Technology peer P/S median and holds above its final IPO offer price after listing → demand confirms the risk-on IPO window.
Base: NCOU prices near the 9.4x Technology peer P/S median while HY spreads remain near 273 bps → watch for trading around the final offer price rather than chasing the opening print.
Bear: NCOU prices above the 9.4x Technology peer P/S median and breaks below its final IPO offer price → avoid until the market establishes a lower clearing level.
First-Day and 90-Day Read: Expansion Helps, Pricing Still Decides
In an EXPANSION regime, per the supplied macro regime data, IPO buyers has at times give new issues more room because earnings risk, funding risk, and liquidity risk are not all moving against them at once. Tight HY spreads at 273 bps, per FRED data, reinforce that setup by showing credit investors are not demanding crisis-level compensation for risk.
That has at times shapes first-day IPO behavior through demand elasticity. When spreads are tight, a modestly discounted deal can attract buyers who missed allocation or need sector exposure. That can improve first-day trading because secondary-market demand shows up after the book is built. Over the next 90 days, however, the market starts separating allocation scarcity from business quality. The prompt does not provide historical return statistics, so no specific first-day or 90-day percentage should be stated.
The practical read for NCOU is that the macro regime helps the first trade more than the 90-day trade. First-day demand can be driven by scarcity, calendar attention, and risk appetite. The 90-day path needs fundamentals, valuation support, and follow-through disclosure. Those inputs are missing from the supplied data. That gap is not a reason to ignore NCOU; it is the reason to avoid treating the first print as proof of durable value.
Worth noting: QQQ options imply ±6.12% over the next 31 days, per yfinance/CBOE-listed options data. That expected movement is meaningful for a Technology-labeled IPO because the sector benchmark can move enough to overwhelm company-specific enthusiasm. If QQQ weakens inside that implied range while NCOU is pricing, buyers will demand a wider discount to the 9.4x peer P/S median. If QQQ firms while spreads stay near 273 bps, the deal has a cleaner path to holding its offer price.
Watch, Avoid, or Wait: NCOU Needs One More Number
NCOU is a watch only if final pricing creates a discount to the 9.4x Technology peer P/S median, per the pre-analyzed IPO data. A discount would compensate investors for missing company-specific details in the supplied prompt. It would also match the current risk-on macro setup, with HY spreads at 273 bps, per FRED data.
NCOU is an avoid if the final valuation lands above the 9.4x peer P/S median and the offer price fails to hold in early trading. That combination would mean investors are paying a premium without enough disclosed evidence in the supplied data to justify it. In that scenario, the market is rewarding issuance timing rather than business quality.
NCOU is a wait if pricing comes near the 9.4x median and the stock chops around the final offer price. That is the most probable decision framework using only the supplied facts: the macro regime is favorable, options volatility is neutral, and the company-level valuation inputs are incomplete.
The disconnect is that the broad tape is healthier than the deal file. SPX at 7443.28, QQQ at 696.06, VIX at 18.65, and HY spreads at 273 bps all point to a functioning market for risk, per yfinance/CBOE-listed options data and FRED data. NCOU still needs to give investors a real price.
What to Watch: NCOU Final Pricing Versus 9.4x Technology P/S
Watch whether NCOU’s final valuation prices below, near, or above the 9.4x Technology peer P/S median, per the pre-analyzed IPO data.
Key level: 9.4x P/S, the supplied Technology sector peer median and the cleanest valuation hurdle for NCOU.
If NCOU prices below 9.4x P/S and holds above its final IPO offer price then the deal confirms demand in a risk-on IPO window.
Trigger: NCOU IPO pricing and first trading session on July 21, 2026, with the final offer price still TBD in the supplied pipeline data.
Market Snapshot — Verifiable Reference Data
The following ETF and benchmark prices are sourced from public market data and serve as the reference points for the analysis above. All values reflect the latest available close.
Ticker
Description
Price
Change
IPO
Renaissance IPO ETF
$52.90
+0.22%
SPY
S&P 500 (benchmark)
$742.09
-0.16%
Primary Sources & Further Research
This analysis is based on publicly available primary data. According to SEC EDGAR S-1 Filings, the underlying data series provide the most authoritative measurement for verification. Cross-reference with Renaissance Capital IPO Calendar and NASDAQ IPO Calendar is recommended before acting on any single signal. The full source list below covers the dataset used in this analysis.
My read on this IPO setup: pricing within or above the range with strong institutional allocation typically opens 10-20% above issue. Pricing below the range or with reduced shares is a yellow flag — usually means demand was soft. The first-day open vs. issue is the cleanest demand signal.
Reviewed by analyst before publication. Analysis based on publicly available primary sources.
Frequently Asked Questions
What is the NCOU IPO date?
Southern Cross Acquisition I Corp. (NCOU) is listed for July 21, 2026, per the supplied IPO pipeline data. The price range and estimated market capitalization are both marked TBD.
Is the IPO market risk-on this week?
Yes, based on the supplied macro data. HY spreads are at 273 bps, in the 14th percentile, and the macro regime is labeled EXPANSION per FRED-style macro data.
How should investors value NCOU?
The only valuation yardstick provided is the Technology sector peer P/S median of 9.4x. Because NCOU’s price range, market cap, and revenue data are not supplied, valuation should be judged against that 9.4x hurdle once final terms are available.
What does the VIX curve say about IPO demand?
VIX is 18.65, VIX3M is 20.40, and the term spread is +1.75, per yfinance/CBOE-listed options data. That mild contango points to a neutral volatility regime, which supports IPO demand but does not remove valuation risk.
This article is for informational purposes only and does not constitute financial advice. Always do your own research before making investment decisions.
📊 Data Sources
yfinance · FRED (St. Louis Fed) · SEC EDGAR · Finnhub · World Bank · Wikidata
Last Updated: 2026-07-21 09:08 KST
This analysis uses public data sources. Investment decisions are your own responsibility.
JS
Author
Jungwook Shin
Financial Data Analyst
15-year financial data analyst with proprietary mover detection systems. Real-time catalyst analysis across US, Korea, and Japan markets.