Market SnapshotAs of 2026-07-18 00:14 ET (intraday change)
S&P 500
$744.22
▼ -0.87%
Nasdaq 100
$693.82
▼ -1.72%
Russell 2000
$293.79
▼ -0.61%
VIX
18.36
▲ +9.74%
US 20Y
$84.68
▲ +0.56%
Dollar
100.74
◆ +0.01%
Gold
$367.40
▲ +0.67%
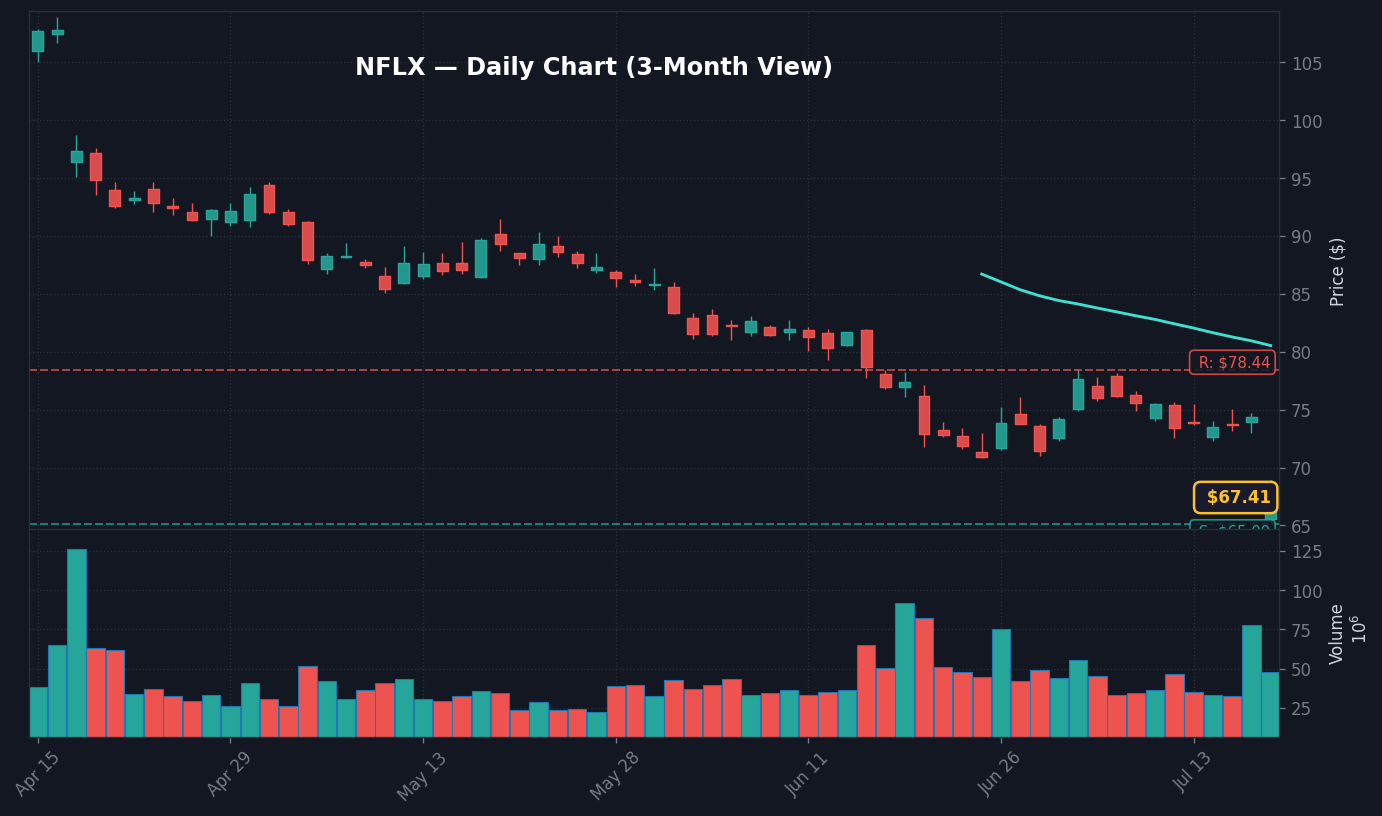
8.4% is the number that matters at 11:11 AM ET: Netflix (NFLX) is trading at $68.10, down 8.4062%, per the supplied breaking market feed.
The thesis is narrow but urgent: NFLX -8.4% is not just a single-ticker red print, because the alert is framed as an S&P 500 gap session and the move is large enough to test whether megacap weakness can spill into index risk. The tape is telling us the first job is not to explain a full earnings story; the first job is to map where the gap stops spreading.
The driver provided is the overnight-to-live-session gap itself, not a named company release. No Netflix earnings figure, guidance change, subscriber metric, SEC filing, analyst downgrade, or management comment was supplied with the 11:11 AM ET alert, so assigning a fundamental catalyst would be fabrication. The key risk is mistaking the first NFLX print for the full market message before liquidity, breadth, index levels, and volatility confirm the damage.
That distinction matters because the macro backdrop is not giving growth stocks an easy cushion. Fed funds are at 3.63% as of June 1, 2026, CPI is running at 3.7% year over year, and the 10Y Treasury sits at 4.55% with a 5-day change of +1bp, per FRED data. Sticky inflation keeps the upside case constrained: if rate-cut timing stays delayed, a single-name recovery has to come from positioning and company-specific demand, not from a broad discount-rate rescue.
NFLX is sitting at $68.10 after an 8.4062% drop, which implies a prior reference price near $74.35 when using the supplied price and percentage move. The implied dollar gap is roughly $6.25, and the midpoint of that gap is about $71.23. Those levels are mechanical reference points from the supplied breaking feed, not observed support or resistance levels.
Starting with the chart matters because the technical snapshot requested for S&P 500 support and resistance was not supplied. That absence is not a detail to bury. It means the cleanest live levels are single-name levels: $68.10 as the current NFLX print, $71.23 as the half-gap recovery line, and $74.35 as the implied pre-drop reference price. What stands out here is that the stock has to recover more than 4.5% from $68.10 just to retake the midpoint of the move.
The first-order impact is simple: a stock that can lose 8.4% inside an S&P 500 gap alert forces traders to test whether the move is isolated or contagious. If NFLX stabilizes above $68.10 while VIX stays near 16.7, the market can treat this as a contained derating. If NFLX loses $68.10 and volatility moves above its 20-day average of 16.9, the message shifts toward broader risk reduction, per the supplied FRED volatility snapshot.
How Do VIX 16.7, 10Y 4.55%, and DXY 120.50 Frame the Selloff?
VIX at 16.7, below its 20-day average of 16.9, says the cross-asset tape has not yet treated NFLX -8.4% as broad stress. The 10Y Treasury at 4.55% and the broad Dollar Index at 120.50, down 0.27% over 5 days, keep the macro read-through contained for now, per FRED data.
The cross-asset bridge is the key discipline here. If NFLX is falling because investors are dumping long-duration equity risk, the usual confirmation would be a stronger volatility bid, a higher real-rate impulse, or a broader dollar squeeze. The supplied data does not show that. VIX is slightly below its 20-day average, the 10Y yield is up only +1bp over 5 days, and the dollar is lower over the same window, per FRED data.
The overlooked read-through: sticky CPI at 3.7% does not need to push yields sharply higher to hurt a stock like NFLX. A Fed funds rate of 3.63% and a 10Y yield of 4.55% already create a higher hurdle rate for future cash flows, per FRED data. When that is the starting point, a company-specific disappointment can produce a large price response even without a fresh macro shock.
Counterintuitively, the calm VIX print is not automatically bullish. It can also mean the market has not bought protection yet. If the NFLX move begins pulling other S&P 500 names lower and VIX then rises through 16.9, the market would be moving from single-name repricing to portfolio-level hedging. That is the difference between a gap that gets faded and a gap that spreads.
Which S&P 500 Gap Stocks Matter Beyond NFLX -8.4%?
The supplied breaking feed identifies NFLX as the only named S&P 500 gap stock, with a price of $68.10 and a change of -8.4062%. No additional tickers, sector returns, or index-level movers were provided, so the breadth of the S&P 500 gap list is missing from the data set.
That missing breadth data changes the interpretation. If other communication services or consumer discretionary names are down in sympathy, NFLX becomes a sector transmission event. If other megacaps are flat and VIX remains around 16.7, NFLX is a sharp but contained single-name repricing. The difference is not cosmetic; it decides whether traders should focus on Netflix-specific levels or on index beta.
Worth noting: the alert severity is marked HIGH, but severity is not a substitute for breadth. A high-severity single-name drop can dominate headlines without forcing systematic selling. The data required to prove wider pressure would include index change, sector performance, volume ratio, options flow, or a full gap table. None of those figures were supplied, so the honest market map keeps NFLX at the center and treats broader contagion as unconfirmed.
The strongest practical read is to separate leadership from laggards using confirmation rather than assumption. NFLX is the laggard in the supplied feed. The leadership side is unknown because no positive S&P 500 gappers were provided. That leaves a market with one visible stress point and no supplied offsetting winners, which is useful but incomplete.
Why Does Sticky CPI 3.7% Limit the NFLX Rebound Case?
CPI at 3.7% year over year and Fed funds at 3.63% argue against a clean discount-rate tailwind for NFLX, per FRED data. The 10Y-2Y spread is positive at 0.42 percentage points, which points to a curve that is no longer sending the same recession-heavy signal as an inverted setup.
The base macro regime is sticky inflation, not a panic-easing regime. That matters for an 8.4% stock decline because rebounds in high-multiple equities are easier when rates are falling, inflation is cooling, and the Fed is being pulled toward cuts. The supplied snapshot does not give that setup. It gives a 4.55% 10Y yield, a 4.13% 2Y yield, and CPI still above 3%, per FRED data.
The disconnect is that a calm VIX can tempt traders to treat NFLX as a quick mean-reversion candidate, while sticky inflation keeps the valuation floor less forgiving. In other words, the absence of broad fear does not automatically create a cheap stock. It only says the market has not yet converted the NFLX shock into system-wide stress.
What the tape is not pricing yet is the possibility that single-name misses become more punishing in a sticky-rate regime. If investors are no longer rewarded for assuming fast policy relief, the market can demand cleaner execution from every growth company. NFLX at $68.10 is the visible case today, but the second-order question is whether the next weak guide in the S&P 500 gets the same treatment.
Bull, Base, Bear: NFLX $68.10 Into the Jul 17 Close
The scenario map should be asymmetric because the starting move is already large. From $68.10, a rebound to the half-gap level near $71.23 is about 4.6% upside, while a full recovery to the implied pre-drop reference near $74.35 is about 9.2% upside. A second gap-sized extension lower would point near $61.85, a mechanical downside marker equal to the initial $6.25 implied gap.
3 Scenarios From Here
Bull: NFLX reclaims $71.23 by the Jul 17 US close while VIX stays below 16.9 → gap-fade trade can target the implied $74.35 reference level.
Base: NFLX holds $68.10 but fails $71.23 → stock remains trapped in a $68.10-$71.23 range into the next US session.
Bear: NFLX loses $68.10 and VIX moves above 16.9 → a second gap-sized extension points mechanically toward $61.85, with broader confirmation still required.
The bull case needs speed. A slow drift that never retakes $71.23 would leave sellers in control because the stock would still be below the midpoint of the break. The base case is the most defensible without more data: NFLX stabilizes, but the market refuses to pay back the full gap because no catalyst reversal was supplied. The bear case needs confirmation from volatility or breadth, not just one more red tick.
This is where traders can misread the move. An 8.4% decline feels decisive, but the next signal is path-dependent. Holding $68.10 with VIX below 16.9 is materially different from losing $68.10 while VIX lifts above its 20-day average, per the supplied FRED volatility comparison. The first is damage control. The second is a wider risk event.
What Happens Next After NFLX Hits $68.10?
The next test is whether NFLX can hold $68.10 and recover the $71.23 midpoint before the Jul 17 US close. The broader market test is whether VIX stays near 16.7 or rises above its 20-day average of 16.9, per FRED data.
There is no supplied official event trigger from the Fed, BLS, EIA, SEC, or Netflix, so the next hard catalyst is live-session confirmation rather than a scheduled release. That makes the final hours of the US cash session more important than usual. A late-day reclaim of $71.23 would change the tone of the break; a close below $68.10 would keep pressure on the next session.
What to Watch: NFLX $68.10 and the Missing S&P 500 Support Level
Watch whether NFLX holds $68.10 after the 11:11 AM ET break and whether it can reclaim $71.23, the midpoint of the implied gap.
Key level: The nearest recent S&P 500 support/resistance level was not supplied in the technical snapshot; the hard level provided for this alert is NFLX at $68.10.
If NFLX loses $68.10 while VIX moves above its 20-day average of 16.9 then the signal shifts from single-name derating toward broader tape stress.
Trigger: Jul 17, 2026 US cash-session follow-through into the close; no official Fed, BLS, EIA, SEC, or company release time was supplied for this break.
Next Session Watchpoints
Volume profile: Watch whether NFLX keeps at least follow-through volume versus normal.
Key level to watch: Use the nearest recent S&P 500 support/resistance level from today’s technical snapshot. is the pivot for continuation.
Catalyst quality: The move needs follow-through headlines or clean price acceptance above the pivot.
Risk trigger: If NFLX loses the opening range quickly, the move shifts from continuation to fade risk.
Frequently Asked Questions
Why did NFLX stock drop 8.4% on Jul 17?
The supplied 11:11 AM ET breaking feed shows NFLX at $68.10, down 8.4062%, under a high-severity S&P 500 gap alert. No company-level catalyst, earnings release, or guidance figure was provided, so the move is treated as a live gap event rather than a fundamental claim.
What price levels matter for NFLX after the $68.10 print?
$68.10 is the hard live price in the supplied feed. The implied pre-move reference price is about $74.35 and the gap midpoint is about $71.23, calculated from the 8.4062% decline.
Is the NFLX 8.4% drop signaling broader market stress?
The supplied FRED snapshot shows VIX at 16.7 versus a 20-day average of 16.9, the 10Y Treasury at 4.55%, and the 10Y-2Y spread at 0.42 percentage points. That points to a single-name shock unless volatility rises above 16.9 or missing sector and index breadth data confirms wider pressure.
This market commentary is for informational use only. The views expressed are those of the author and do not constitute financial, investment, or trading advice.