High-yield spreads at 269 bps anchor this week’s IPO tape in a risk-on regime, yet STDN, CSQR, and EWAVU require pricing disclosure before their risk-to-reward profiles become actionable, per the latest IPO data.
| Company | Symbol | Date | Price Range | Est. Mkt Cap | Sector |
|---|---|---|---|---|---|
| Standard Nuclear, Inc. | STDN | 2026-07-16 | TBD | TBD | Technology |
| Csquare, Inc. | CSQR | 2026-07-16 | TBD | TBD | Technology |
| East West Ave Acquisition Corp. | EWAVU | 2026-07-15 | TBD | TBD | Technology |
3 Technology Listings, 0 Price Ranges
East West Ave Acquisition Corp. (EWAVU) lists 2026-07-15, followed by Standard Nuclear (STDN) and Csquare (CSQR) on 2026-07-16. All three are classified as Technology, yet all three report TBD for price ranges and market caps.
What matters is the disconnect between a receptive macro environment and deal-level opacity. The Technology peer P/S median is 9.1x for these issues, per the pre-analyzed IPO data. Without revenue or float data, there is no way to confirm if these deals price above or below that 9.1x line.
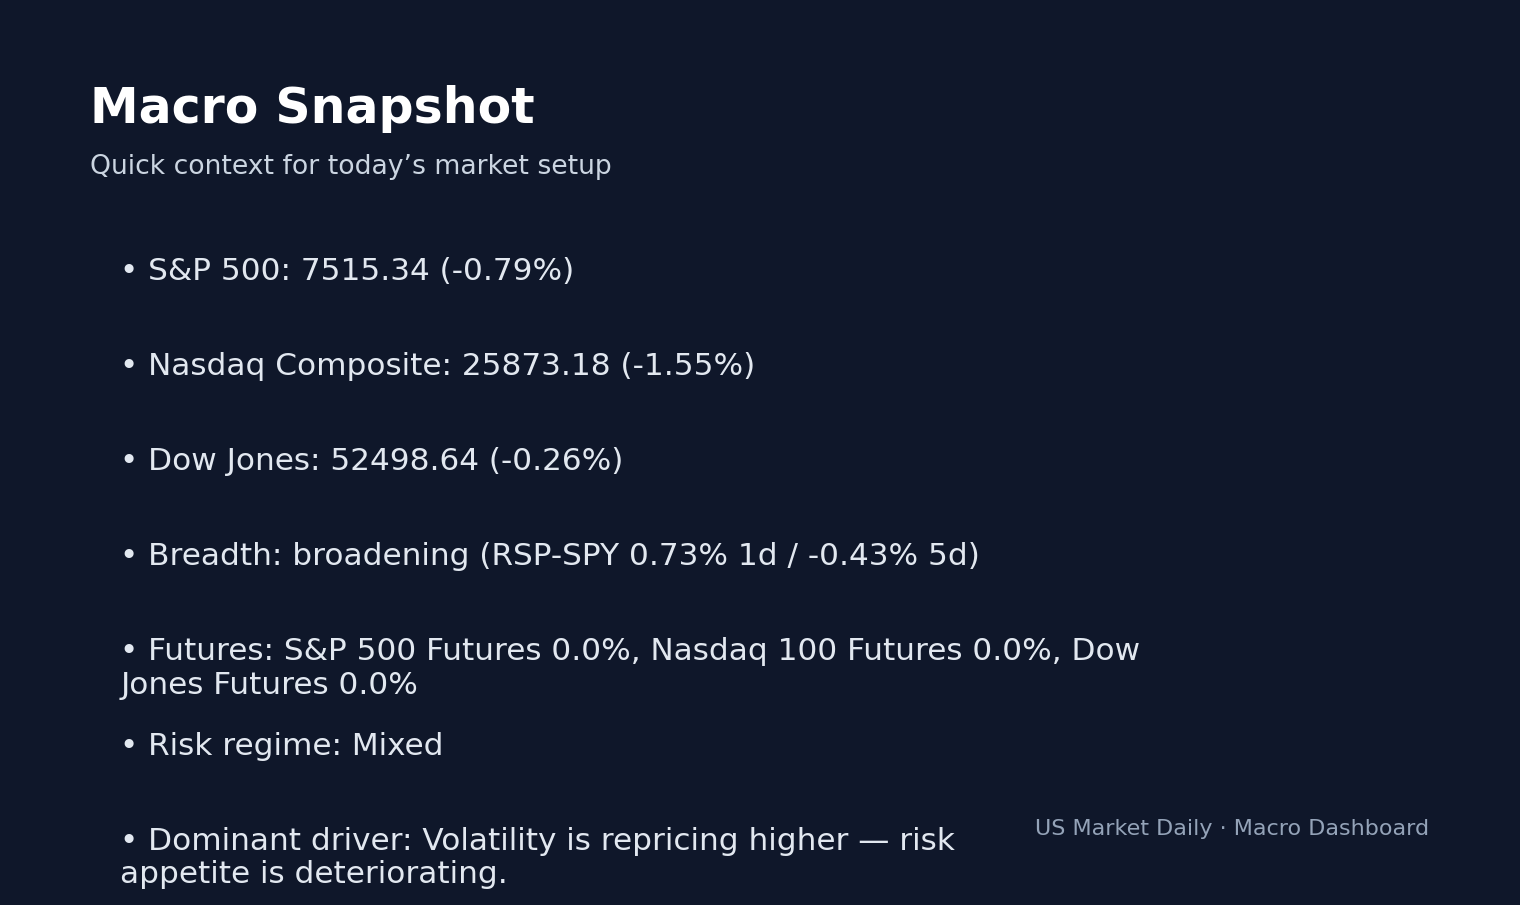
What stands out is the mismatch between macro support and deal visibility. HY spreads at 269 bps (4th percentile) signal a complacent risk-on credit market, which has at times pushes capital toward equity beta. While this brings investors to the book, it does not solve the lack of valuation context.
STDN on July 16: The Lead Deal Has the Widest Information Gap
Standard Nuclear (STDN) leads the week due to its July 16 date and Technology sector classification. The provided filings contain no operating description, revenue figures, or margin data. STDN remains a Technology IPO candidate, but no further business specifics exist.
This matters because the 9.1x P/S peer median serves as a benchmark rather than a target. If STDN carries recurring revenue and a clear path to scale, a premium to the 9.1x median is justifiable. If revenue is episodic, that 9.1x multiple represents a risk flag. The bull case requires the final filing to reveal a revenue base that allows a direct comparison to the 9.1x Technology median.
The risk is that the 9.1x median becomes a substitute for due diligence. If investors ignore the absence of revenue and float metrics, they transition from analysis to momentum allocation. This setup is fragile because late-cycle buyers are less patient following the first-day print.
9.1x P/S Is the Line STDN Must Earn
For STDN, the 9.1x P/S multiple acts as the valuation divider until further data arrives. A valuation below this median provides a cleaner path for institutional demand. A price at or above 9.1x requires disclosed growth or quality metrics to sustain interest.
Verdict on STDN: watch. The key trigger is a disclosed price range and estimated market cap before 2026-07-16. If the implied valuation sits below the 9.1x Technology peer P/S median, it moves to the active list.
CSQR on July 16: Same Sector, Less Room for Story Premium
Csquare (CSQR) lists 2026-07-16 with a TBD range and TBD market cap. It faces the same 9.1x P/S Technology median as its peers. The real story here is deal fatigue; with STDN also listing on the 16th, CSQR needs either a steeper discount or better fundamentals to differentiate itself.
Verdict on CSQR: wait. The trigger is a price range that offers a clear discount to the 9.1x Technology peer P/S median. Without that, it remains a secondary observation rather than a high-conviction setup.
EWAVU on July 15: SPAC Timing Beats Operating Detail
East West Ave Acquisition (EWAVU) lists 2026-07-15. As an acquisition vehicle, the core debate involves sponsor quality and structure, neither of which appear in the provided data. The only firm facts are the date and sector.
Verdict on EWAVU: avoid for now. The trigger to revisit is the full disclosure of structure-level terms and pricing.
269 bps HY Spreads Say the IPO Window Is Open
Tight credit spreads at 269 bps signal that investors are demanding less compensation for risk, which fuels equity appetite. This is a LATE_CYCLE regime, per the supplied macro data. While this backdrop lowers the barrier for initial issuance, post-IPO performance remains subject to valuation discipline.
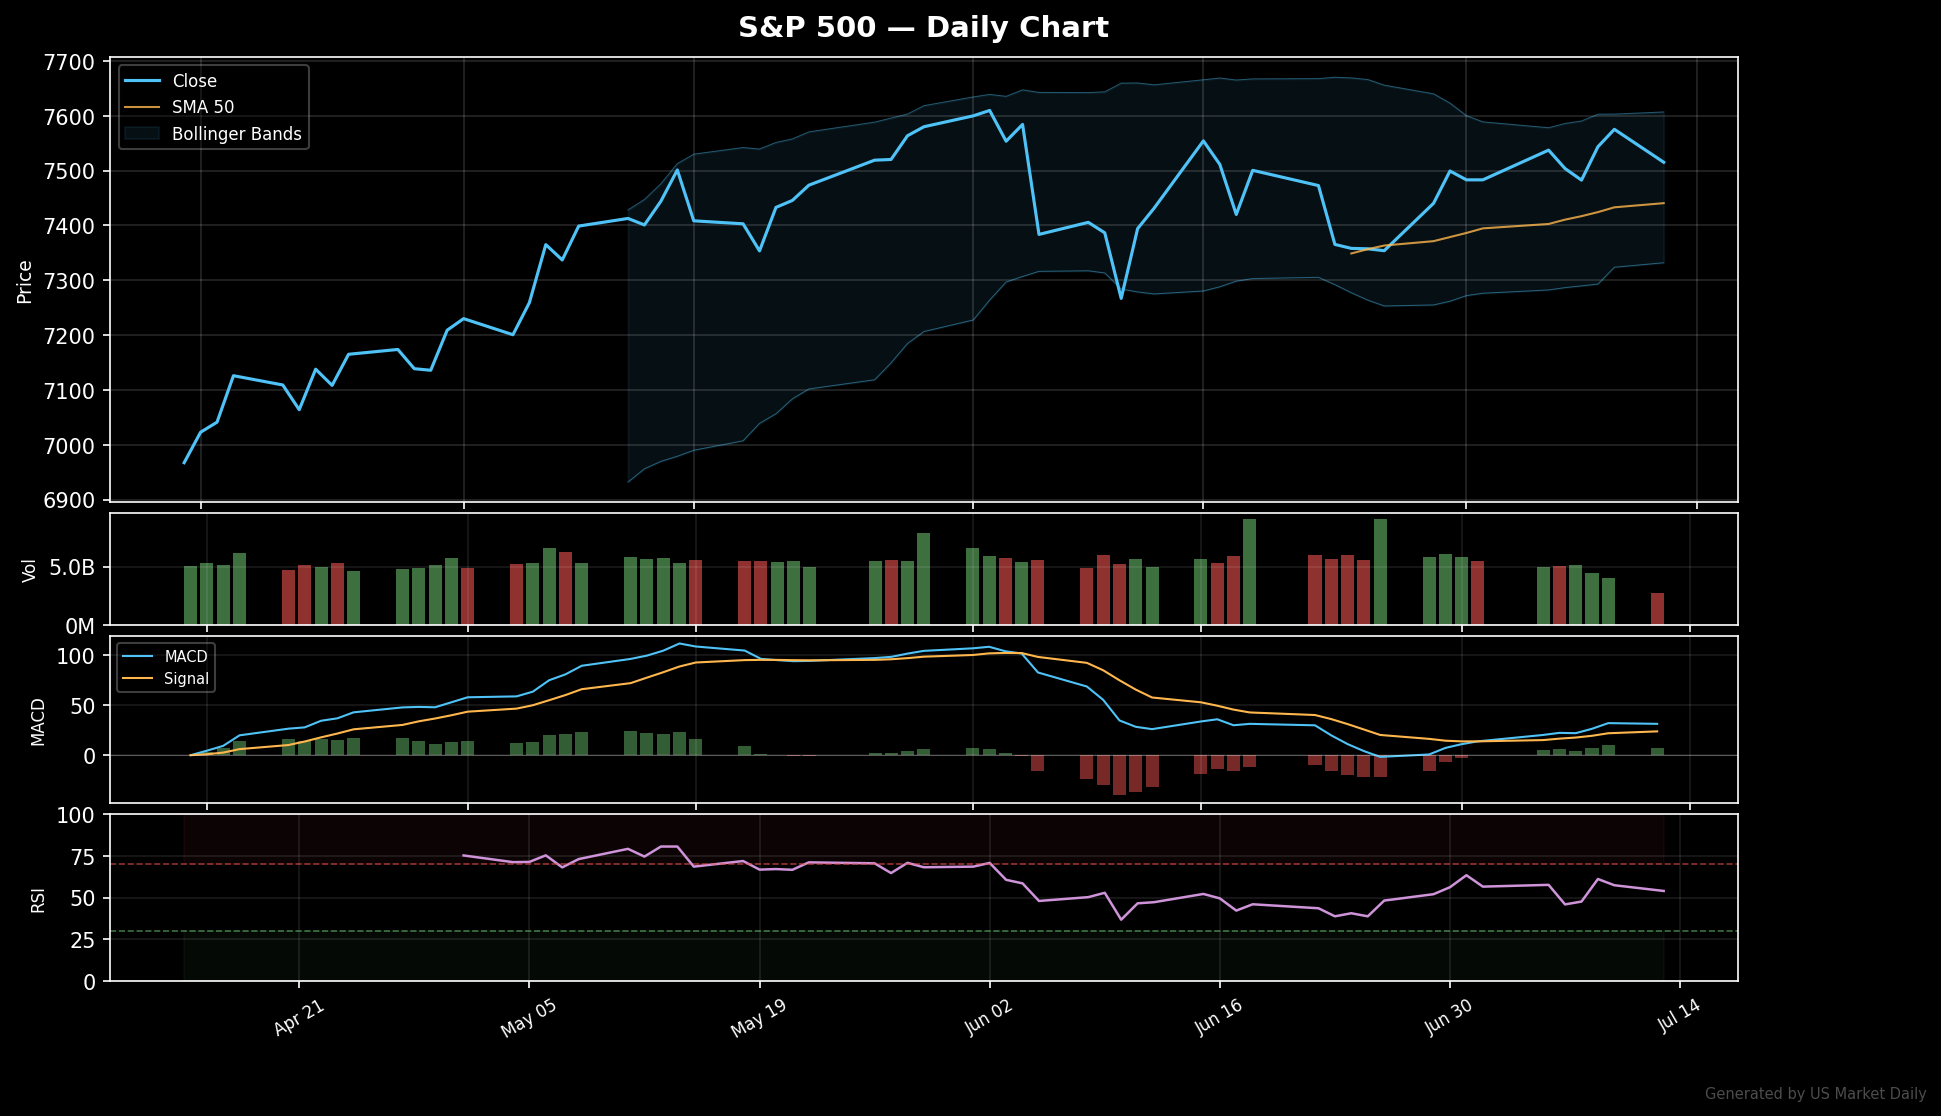
The VIX curve—VIX at 17.16 and VIX3M at 19.64—shows mild contango of +2.48, signaling that the market is not pricing an immediate shock. This provides a window for new supply. QQQ spot of 711.74 with ±5.83% implied movement suggests technology-linked volatility remains elevated, which adds pressure to the valuation requirements for STDN and CSQR.
What the Tape Is Not Pricing: Too Much Credit Calm, Too Little Deal Data
The real story is that tight HY spreads are being misread as a green light for all issuance. The disconnect is that credit calm cannot solve missing valuation math. What’s notable is that even with 269 bps spreads, the lack of price ranges makes underwriting impossible.
Counterintuitively, a risk-on macro tape increases the need for selectivity. When spreads are this tight, weak deals can get out on momentum alone. The signal from the tape is that investors should look for the deals that have the disclosure to survive the first rotation out of the IPO trade.
3 Scenarios for STDN, CSQR, and EWAVU
3 Scenarios From Here
- Bull: STDN and CSQR disclose price ranges below the 9.1x peer median, fueling first-day demand.
- Base: Prices remain TBD, keeping STDN on watch, CSQR on wait, and EWAVU on avoid.
- Bear: Deals price above 9.1x without revenue disclosure, turning the trade into a momentum-only pop followed by 90-day risk.
Verdicts by Ticker: STDN Watch, CSQR Wait, EWAVU Avoid
- STDN — Watch: Trigger is price disclosure below 9.1x P/S.
- CSQR — Wait: Trigger is a clear valuation discount to 9.1x P/S.
- EWAVU — Avoid: Trigger is full structure-level disclosure.
STDN: Valuation Triggers
- Watch whether STDN discloses a price range and market cap before its 2026-07-16 listing.
- Key level: 9.1x Technology peer P/S median.
- What would confirm this: Pricing below 9.1x P/S with revenue disclosure.
- What would break this setup: Pricing at or above 9.1x P/S with no disclosed financials.
Market Snapshot — Verifiable Reference Data
The following ETF and benchmark prices are sourced from public market data and serve as the reference points for the analysis above. All values reflect the latest available close.
| Ticker | Description | Price | Change |
|---|---|---|---|
| IPO | Renaissance IPO ETF | $55.71 | -3.23% |
| SPY | S&P 500 (benchmark) | $749.17 | -0.77% |
Primary Sources & Further Research
This analysis is based on publicly available primary data. According to SEC EDGAR S-1 Filings, the underlying data series provide the most authoritative measurement for verification. Cross-reference with Renaissance Capital IPO Calendar and NASDAQ IPO Calendar is recommended before acting on any single signal. The full source list below covers the dataset used in this analysis.
- SEC EDGAR S-1 Filings
- Renaissance Capital IPO Calendar
- NASDAQ IPO Calendar
- IPO Pricings Tracker
- SEC IPO Reference
Reading the actual filing text or official data series — not just summaries — provides the most accurate picture for any analytical position.
Editor’s Insight — Jungwook Shin, Small-Cap Equity Analyst
What I watch on IPO Day 1: the lockup expiration (~180 days) is when supply pressure can hit. Strong IPOs typically hold above issue for the full lockup; weak ones break below. The 30/60/90/180-day price action tells you whether institutional demand is durable.
Reviewed by analyst before publication. Analysis based on publicly available primary sources.
Frequently Asked Questions
What IPOs are scheduled for the week of July 14, 2026?
The supplied IPO pipeline lists East West Ave Acquisition Corp. (EWAVU) for 2026-07-15, and Standard Nuclear (STDN) plus Csquare (CSQR) for 2026-07-16. All three are tagged as Technology, with price ranges and estimated market caps marked TBD.
Is Standard Nuclear (STDN) a buy before its IPO?
No direct buy recommendation is supported by the supplied data. STDN is a watch-list deal because HY spreads are 269 bps, but the price range, estimated market cap, revenue, and operating description are missing from the prompt data.
What valuation level matters for STDN and CSQR?
The key valuation reference is the 9.1x Technology peer P/S median provided in the pre-analyzed IPO data. STDN or CSQR would need disclosed pricing and revenue context before investors can judge whether the IPO is cheap or expensive versus that median.
What does HY spread at 269 bps mean for IPO demand?
HY spreads at 269 bps, in the 4th percentile, indicate a risk-on credit backdrop in the supplied macro regime data. That can support first-day IPO demand, but it does not replace deal-level pricing, valuation, and business disclosures.
Why is EWAVU rated avoid for now?
EWAVU is scheduled for 2026-07-15, but the supplied data does not include price range, estimated market cap, target detail, or acquisition-vehicle structure terms. Without those inputs, investors cannot compare it meaningfully against the 9.1x Technology peer P/S median.
📚 Related Articles
- Terrestrial Energy (IMSR) +14% on Earnings Results Or Guidance — Is the Upside
- Sector Rotation Tracker — Weekly Flow Analysis
- IPO Radar Jun 02, 2026: Seven Tech-Heavy Listings Test a VIX 16 Window —
- META vs GOOG: Which Stock Is the Better Buy in May 2026?
- CRM -6.2% on Jun 2: Salesforce Guidance Cut Drags S&P 500 Software Cohort
Explore the Earnings & Reactions Playbook
This article fits into our Earnings & Reactions topic cluster and is meant to serve what happened.
Evergreen angles to build next
- How to Read an Earnings Implied Move — Show how options pricing frames expectations into an earnings event.
- Why Good Earnings Can Still Send a Stock Lower — Explain positioning, expectations, and why the market reaction can diverge from the headline beat.
- How to Judge Catalyst Quality — Separate confirmed catalysts from weak headline narratives, flow-only moves, and low-conviction tape action.
Cluster-adjacent reads
Earnings Reaction Playbook
A hub for reading expectation gaps, implied moves, guidance tone, and post-earnings price action.
Suggested reading path
- Read the implied move explainer first
- Then study good-results/bad-reaction setups
- Use fresh preview articles as live case studies
Core evergreen guides in this hub
- How to Read an Earnings Implied Move — Show how options pricing frames expectations into an earnings event.
- Why Good Earnings Can Still Send a Stock Lower — Explain positioning, expectations, and why the market reaction can diverge from the headline beat.
- How to Judge Catalyst Quality — Separate confirmed catalysts from weak headline narratives, flow-only moves, and low-conviction tape action.
Glossary anchors: implied move, guidance, beat rate, expectation gap
This analysis is provided for educational and informational purposes only. It is not investment advice. Consult a qualified financial advisor before acting on any information presented here.