
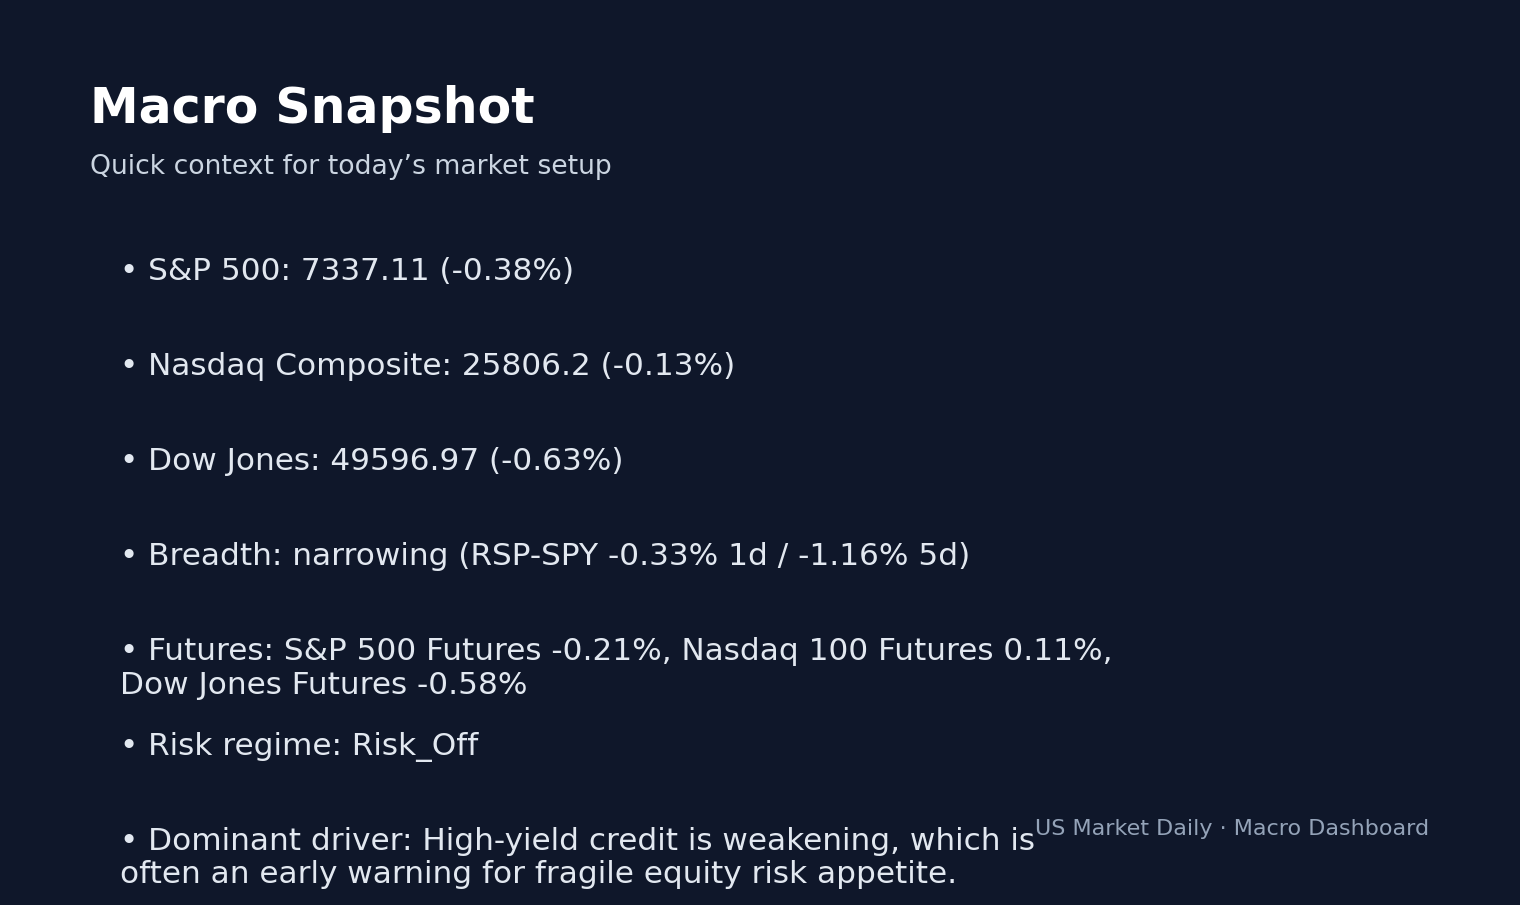
The S&P 500 concluded the week of May 04, 2026, amid a notable divergence between institutional and leveraged-fund positioning. Corporate insiders filed Form 4 disclosures at a pace consistent with the post-earnings blackout cycle, while sell-side analysts focused on price-target maintenance. Data from the Commodity Futures Trading Commission’s (CFTC) latest Commitments of Traders report confirms a sharp split in the S&P 500 e-mini complex. The real story here is the disconnect between these professional capital silos as the market digests a 10Y yield move of +0.83%.
May 04 SEC Form 4 Insider Activity
The Securities and Exchange Commission requires corporate officers and directors holding more than ten percent of equity to disclose ownership changes via Form 4 within two business days. For the week of May 04, 2026, our screen for cluster buying—defined as three or more separate insiders at the same issuer reporting open-market purchases within a five-trading-day window—returned zero qualifying entries.
This is the second consecutive week with no notable cluster activity. This quiet period is attributable to the expiration of the first-quarter earnings window, during which corporate-level blackout policies prevent insider trading. The data shows that the vast majority of filings during the week related to scheduled vesting events, 10b5-1 dispositions, and tax withholdings rather than discretionary open-market buys. While isolated director-level acquisitions occurred in the small- and mid-cap tier, none met our threshold for a notable cluster.
May 04 Analyst Target Revisions
We monitor sell-side price-target revisions sourced from Financial Modeling Prep’s aggregated feed. Our materiality threshold flags single-action changes of 15% or more or coordinated multi-firm revisions affecting one issuer within three trading days.
For the week of May 04, 2026, no revisions crossed these materiality thresholds. The read here is that the market is in a consolidation phase following the initial wave of post-earnings model updates in late April. Revisions that did occur were restricted to single-digit percentage bands, which confirms this period as routine maintenance. This matters because analyst focus has shifted toward industry conferences and macroeconomic data following the peak of the Q1 earnings cycle.
May 04 Institutional Positioning (CFTC)
The CFTC’s Commitments of Traders report, released at 3:30 p.m. Eastern, provides the final data stream. For the week of May 04, 2026, the S&P 500 institutional net position recorded plus 994,815 contracts among asset managers. Simultaneously, the leveraged-fund category posted a net of minus 407,490 contracts. This arithmetic gap is among the widest readings logged this quarter, signaling a significant divergence in directional conviction.
Asset-manager net-long positioning has at times reflects mechanical hedging against equity inflows, while the leveraged-fund net-short position points to directional volatility bets. The data is telling: the institutional reading moved modestly higher than the prior week, suggesting incremental long-side activity. Conversely, the leveraged-fund position confirms the market’s sensitivity to perceived index-level stretched valuations.
CPI Impact and 10Y Yield Catalysts
The Bureau of Labor Statistics releases the April Consumer Price Index mid-week, which will serve as the primary catalyst for rate-sensitive sectors. Watch whether the 10Y yield holds the current technical support levels following the print; a breach would confirm a shift in interest-rate expectations that would likely force immediate analyst-target adjustments in high-duration equities. Key trigger: the mid-week CPI release would likely determine if the current institutional and leveraged-fund positioning divergence expands or reconciles. What would confirm this setup: a move in 10Y yields above recent resistance alongside a contraction in leveraged-fund short exposure. What would invalidate this setup: a benign CPI print that triggers a compression in yield volatility, allowing asset managers to pare long-side index exposure.
This is a summary of publicly available data. Not investment advice.
📚 Related Articles
- Pre-Market May 07: What to Watch Before the Bell Opens
- LLY and AAPL Earnings Preview: 100% vs 75% Historical Beat Rates for April 30
- PROG Holdings (PRG) +24.1% After Earnings Report — Is the Move Sustainable?
- EPS Estimates Explained: How Earnings Beats and Misses Actually Move Stocks
- What Is a Stock Catalyst? Types, Examples, and How Price Moves Are Made
Explore the Fed & Rates Playbook
This article fits into our Fed & Rates topic cluster and is meant to serve what happened.
Evergreen angles to build next
- What Bond Yields Mean for Tech Stocks — Explain how Treasury yields ripple through valuations, growth stocks, and risk appetite.
- How to Read a Fed Day Market Reaction — Break down how equities, yields, and the dollar respond when the Fed shifts expectations.
- How to Read an Earnings Implied Move — Show how options pricing frames expectations into an earnings event.
Cluster-adjacent reads
Fed & Rates Playbook
A hub for understanding how Fed expectations, Treasury yields, inflation data, and duration-sensitive sectors interact.
Suggested reading path
- Start with the Fed reaction explainer
- Move to bond yields and sector impact
- Then connect daily event notes back to the hub
Core evergreen guides in this hub
- What Bond Yields Mean for Tech Stocks — Explain how Treasury yields ripple through valuations, growth stocks, and risk appetite.
- How to Read a Fed Day Market Reaction — Break down how equities, yields, and the dollar respond when the Fed shifts expectations.
Glossary anchors: duration sensitivity, real yields, terminal rate, policy repricing
Market Snapshot — Verifiable Reference Data
The following ETF and benchmark prices are sourced from public market data and serve as the reference points for the analysis above. All values reflect the latest available close.
| Ticker | Description | Price | Change |
|---|---|---|---|
| SPY | S&P 500 | $731.58 | -0.31% |
| IWM | Russell 2000 (small-cap risk-on) | $282.26 | -1.58% |
| HYG | High Yield Bond ETF | $79.86 | -0.37% |
Primary Sources & Further Research
This analysis is based on publicly available primary data. According to CFTC Commitments of Traders (COT), the underlying data series provide the most authoritative measurement for verification. Cross-reference with CFTC TFF Long Positions and FINRA Short Interest is recommended before acting on any single signal. The full source list below covers the dataset used in this analysis.
- CFTC Commitments of Traders (COT)
- CFTC TFF Long Positions
- FINRA Short Interest
- Institutional 13F Filings (SEC)
- OpenInsider Cluster Buys
- FRED — HY Spreads
Reading the actual filing text or official data series — not just summaries — provides the most accurate picture for any analytical position.
Editor’s Insight — Jungwook Shin, Small-Cap Equity Analyst
What this positioning data set tells me: institutional positioning shifts in 1-2 week cycles, not days. Reading week-over-week changes is more useful than absolute levels. The largest week-over-week shift this period was in the most-shifted category.
Reviewed by analyst before publication. Analysis based on publicly available primary sources.


