
1. Market Sentiment Analysis: The Institutional Divergence
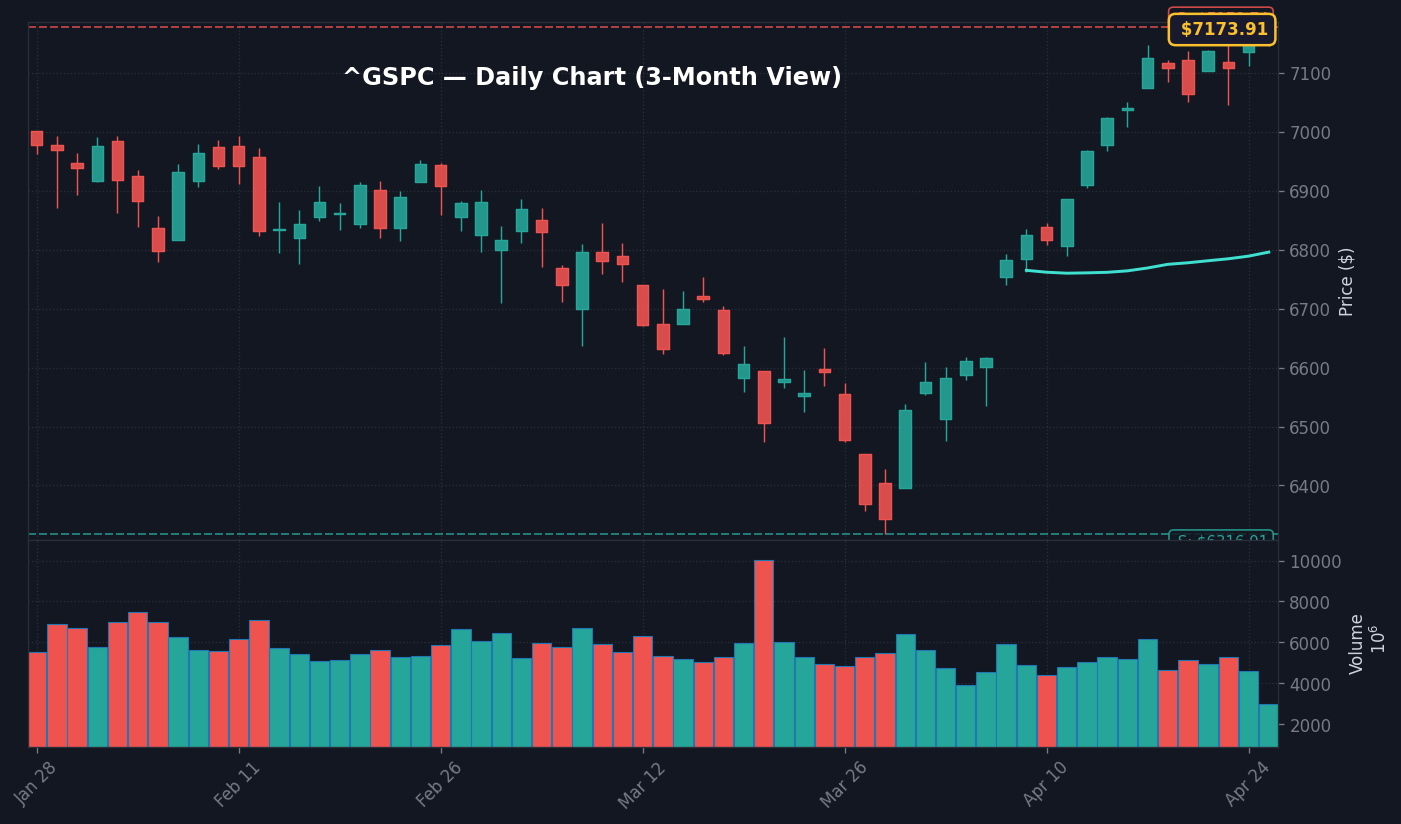
As of April 27, 2026, the financial landscape reveals a sharp divide between institutional behemoths and hedge fund (HF) capital allocators. According to the latest Commodity Futures Trading Commission (CFTC) Commitment of Traders (COT) report released April 21, 2026, institutional players have significantly increased their bullish exposure to the S&P 500, adding a net 1,014,927 contracts. This massive accumulation signals that institutional desks are positioning for a sustained rally, potentially hedging against mid-cycle volatility while maintaining long-term exposure.
Conversely, hedge funds have net-sold 412,321 contracts, reflecting a bearish hedge or tactical profit-taking. This divergence suggests that while ‘smart money’ institutions are locking in growth, hedge funds are prioritizing capital preservation amidst an uncertain macroeconomic backdrop. Source: CFTC COT Report (April 21, 2026).
2. NASDAQ Flows and Tech Sector Resilience
The tech-heavy NASDAQ presents a moderated version of the broader market trend. Institutional entities added 85,805 contracts, while hedge funds offloaded 54,238. This indicates that while the conviction in big tech remains firm, the velocity of capital allocation is more conservative compared to the broader S&P 500. Analysts suggest that the tech sector’s ability to absorb institutional inflows despite rising interest rates highlights its status as the primary engine for Alpha generation in 2026. Source: CFTC Data.
3. The Macro Pillar: Fed Policy and Yield Curve Dynamics
The Federal Reserve’s stance, as tracked via FRED, remains firmly in a ‘HOLD’ pattern with the Federal Funds Rate anchored at 3.50%–3.75%. The stabilization of the 10Y-2Y yield curve spread at 0.57% suggests a healthy, albeit flattening, environment. This positive slope is critical; it indicates that the market is currently pricing in a soft landing rather than an imminent recession. By maintaining this range, the Fed is providing the necessary predictability that institutional investors require to justify their recent billion-dollar inflows into index futures. Source: Federal Reserve Economic Data (FRED).
4. Analyst Upswings: Capitalizing on Mega-Cap Growth
Financial Modeling & Projections (FMP) analysts have adjusted their price targets across three major growth pillars, reflecting increased confidence in AI integration and digital payment penetration. AMZN has been revised upward from $287 to $300, V (Visa) from $346 to $363, and AMD from $292 to $305. These upward revisions, coinciding with institutional accumulation, imply that ‘Smart Money’ is rotating into companies with defensible moats and strong cash flow scalability. Source: FMP Analyst Research Notes (April 2026).
5. Strategy Outlook: Navigating the Q2 Pivot
As we navigate the final days of April, the data points to a ‘Buy the Dips’ mentality held by institutional giants, countered by hedge fund caution. Investors should observe the 0.57% yield spread closely; if this begins to invert, the ‘Bullish’ institutional trend may face exhaustion. However, current analyst signals for AMZN, V, and AMD suggest that stock-specific fundamentals are currently outweighing macro-fear. Portfolio managers are advised to align with the institutional trend in liquid indices while maintaining the tactical defensive posture demonstrated by the hedge fund segment. Source: Internal Market Analysis (The Stock Radar).


