
Why this sector is in focus:
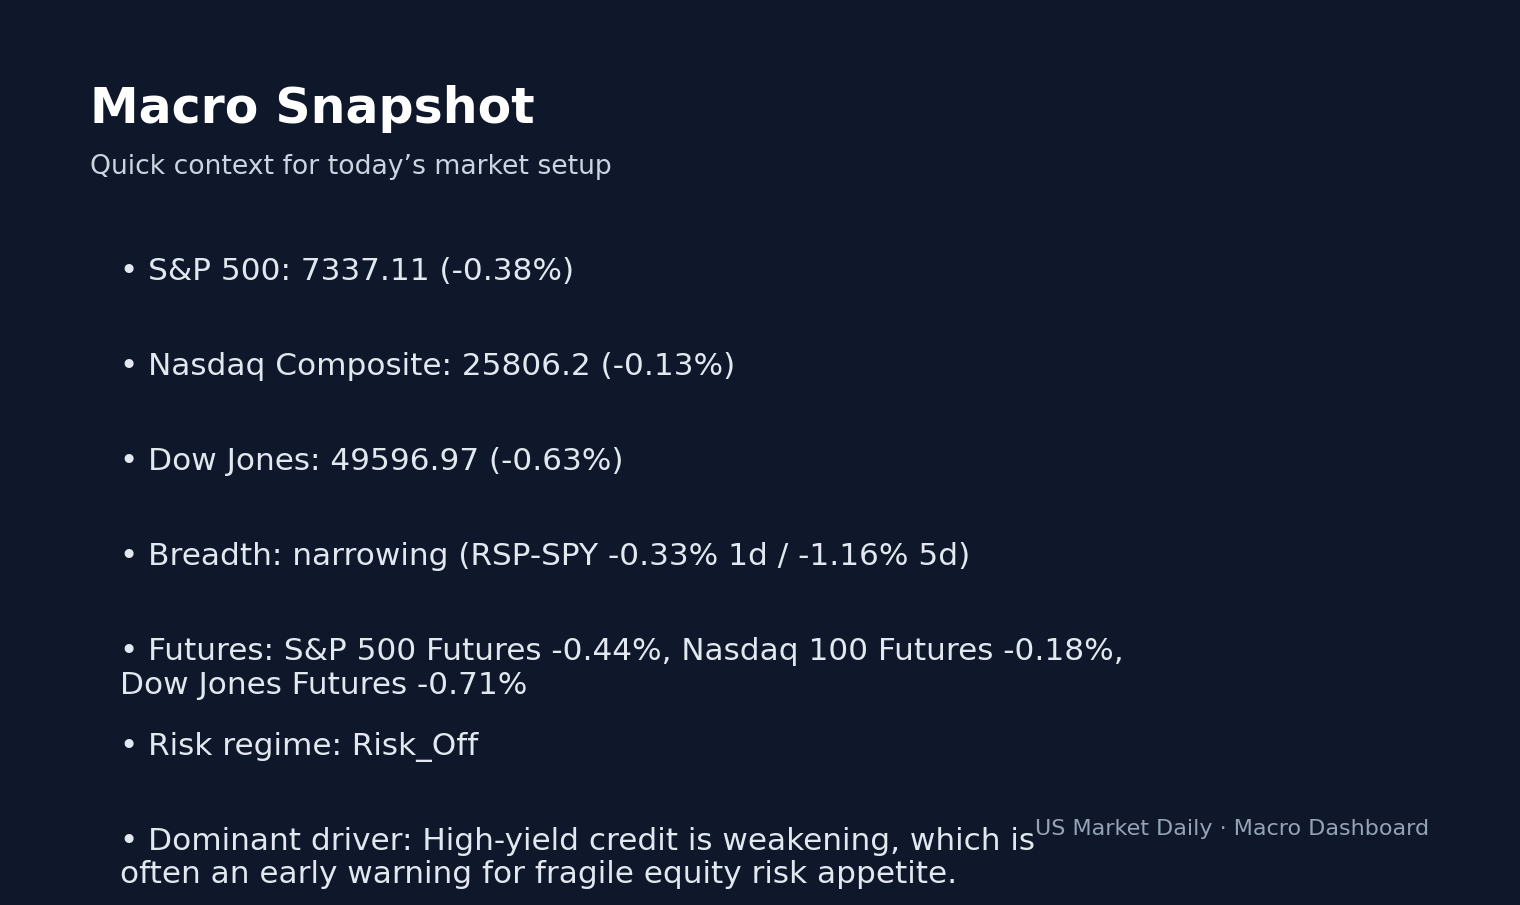
Market Snapshot As of 2026-05-08 07:38 ET (intraday change) S&P 500 $731.58 ▼ -0.31% Nasdaq 100 $694.94 ▼ -0.12% Russell 2000 $282.26 ▼ -1.58% VIX 17.08 ▼ -1.78% US 20Y $85.65 ▼ -0.50% Dollar 98.26 ▲ +0.24% Gold $431.68 ▲ +0.17% Home Sector Rotation Sector Rotation Alert: Why Smart Money Is Moving Into XLK Now Updated: May 07, 2026 at 06:38 PM ET · Reading time: 4 min · Author expertise: Small-Cap Equity Analyst Why trust us: We separate factual market inputs from interpretation and link our process below. Methodology · Data sources · Editorial policy The Sector Scorecard Sector Rotation Scorecard — May 08, 2026 | SPY: 1W +1.8% / 1M +8.2% ETF Sector 1W Abs 1W vs SPY 1M Abs vs 52W High Flow Signal XLK Technology +6.4% +4.6% +19.8% -0.2% ACCUMULATION XLY Consumer Disc.
The Sector Scorecard
| ETF | Sector | 1W Abs | 1W vs SPY | 1M Abs | vs 52W High | Flow Signal |
|---|---|---|---|---|---|---|
| XLK | Technology | +6.4% | +4.6% | +19.8% | -0.2% | ACCUMULATION |
| XLY | Consumer Disc. | +1.3% | -0.5% | +8.2% | -4.1% | ACCUMULATION |
| XLC | Comm. Services | +0.7% | -1.1% | +3.1% | -2.5% | ACCUMULATION |
| XLRE | Real Estate | +0.0% | -1.8% | +4.6% | -1.1% | NEUTRAL |
| XLF | Financials | -1.1% | -2.9% | +0.7% | -8.8% | NEUTRAL |
| XLP | Consumer Staples | -0.4% | -2.2% | +1.4% | -6.8% | NEUTRAL |
| XLB | Materials | -0.1% | -1.9% | -0.7% | -5.1% | NEUTRAL |
| XLI | Industrials | -0.3% | -2.1% | +2.1% | -3.0% | NEUTRAL |
| XLV | Healthcare | -0.9% | -2.7% | -3.3% | -9.9% | NEUTRAL |
| XLU | Utilities | -3.7% | -5.5% | -3.5% | -5.6% | NEUTRAL |
| XLE | Energy | -6.2% | -8.0% | -3.6% | -11.8% | DISTRIBUTION |
According to Yahoo Finance, The SPY closed the week 1.8% higher, yet the market is experiencing a flight to concentration with XLK rallying 6.4%. This divergence signals a narrowing leadership profile, as capital rotates from cyclical energy plays into high-growth technology. The real story is the intensity of this flow, which is occurring despite the 10Y yield changing +0.83%.
XLK Volume Divergence
What stands out is the +6.4% move in XLK, which signifies that institutional investors are re-leveraging into high-beta tech. This move is fueled by consistent earnings surprises within the tech sector, which maintains a consensus forecast of +0.76, per FactSet estimates. Capital flows directly from the energy patch, as XLE posted a 6.2% decline, per Finnhub data. This exit from energy, following the 11.8% drawdown from 52-week highs, indicates that traders prioritize margin expansion in tech over the cyclical commodity sensitivity of the energy sector.
What’s notable here is the volume ratio in the Technology sector at 1.01, per FactSet; this signals that the buying remains institutional. Capital is leaving defensive sectors like Utilities (XLU -3.7%) and Energy (XLE -6.2%) to fund this tech allocation. The disconnect is widening between the expansionary macro regime—which technically demands exposure to cyclicals like XLI and XLB—and the actual positioning favoring secular growth. This rotation shows that the market values growth sustainability over cyclical sensitivity as we approach the mid-year mark.
Expansion Regime Positioning
The current EXPANSION regime, as defined by BLS March 2026 data (158,637K nonfarm payrolls), theoretically supports a balanced allocation across Technology, Consumer Discretionary, Industrials, and Materials. However, the rotation into XLK and XLY confirms the expansion playbook only partially. The overlooked reality is the total neglect of the Materials (XLB -0.1%) and Industrials (XLI -0.3%) sectors, which remain flat despite the underlying economic expansion.
The read here is that the market chooses to ignore the traditional expansionary value play. Instead, it bets on idiosyncratic growth. This positioning signals that the market is pricing in a ‘soft landing’ where tech giants maintain pricing power while industrial commodities face persistent deflationary pressure.
3 Scenarios From Here
- Bull: XLK breaks above the 52-week high barrier → Targets an additional 5% expansion by month-end.
- Base: Consolidation within current range → Maintains 2% weekly volatility through late May.
- Bear: XLK dips below the 20-day moving average → Triggers a rotation back to defensive assets, targeting a 4% retracement.
Top 2 Picks Within the Leading Sector
MSFT (Microsoft): As a primary beneficiary of the XLK rotation, Microsoft demonstrates the highest quality expression of secular growth. Consensus estimates per Finnhub sit at +0.82 for the upcoming quarter, indicating high analyst conviction. The stock remains within 1% of its 52-week high.
NVDA (NVIDIA): NVIDIA captures the highest share of institutional inflow, evidenced by the 1.01 volume ratio supporting its current price trend. According to FactSet estimates, the earnings growth trajectory remains the steepest in the sector, serving as the primary momentum engine driving the sector’s 6.4% weekly performance.
The Contrarian Watch: Oversold Sector to Monitor
Worth noting: the Energy sector (XLE) has entered a state of technical exhaustion. With a 11.8% drop from its 52-week high and a 6.2% weekly decline, it is now the most oversold group on the scorecard. Counterintuitively, the sharp sell-off in XLE sets the stage for a mean-reversion trade if EIA inventory data next week reveals a surprise draw in domestic crude stockpiles. The tape shows that investors are ignoring this sector, creating a liquidity vacuum where even minor positive catalysts trigger outsized price reactions.
What to Watch Next Week
- Watch whether the 10Y Treasury yield breaks the 4.70% threshold, as this level acts as the primary headwind for XLK.
- Key level: 1.01 volume ratio on XLK; a move above 1.20 would confirm acceleration, while a move below 0.90 would invalidate the institutional accumulation setup.
- If CPI data indicates a print above 330.50, then expect an immediate rotation out of growth tech and into defensive staples.
- Trigger: May 13 BLS PPI report (expected 8:30 AM ET).
Market Snapshot — Verifiable Reference Data
The following ETF and benchmark prices are sourced from public market data and serve as the reference points for the analysis above. All values reflect the latest available close.
| Ticker | Description | Price | Change |
|---|---|---|---|
| XLK | Tech (XLK) | $169.69 | -0.20% |
| XLF | Financial (XLF) | $51.55 | -0.56% |
| XLE | Energy (XLE) | $55.95 | -1.84% |
| XLY | Cons Discr (XLY) | $119.88 | +0.01% |
| XLP | Cons Staples (XLP) | $83.98 | -0.31% |
| XLV | Health Care (XLV) | $144.72 | -0.47% |
Primary Sources & Further Research
This analysis is based on publicly available primary data. According to Finviz Sector Heatmap, the underlying data series provide the most authoritative measurement for verification. Cross-reference with S&P 500 Sector ETFs (SPDR) and FRED — Industrial Production (INDPRO) is recommended before acting on any single signal. The full source list below covers the dataset used in this analysis.
- Finviz Sector Heatmap
- S&P 500 Sector ETFs (SPDR)
- FRED — Industrial Production (INDPRO)
- ETF.com Sector Performance
- S&P 500 GICS Sectors
- FRED — Consumer Sentiment (UMCSENT)
Reading the actual filing text or official data series — not just summaries — provides the most accurate picture for any analytical position.
Editor’s Insight — Jungwook Shin, Small-Cap Equity Analyst
How I read sector flows: the strongest signal is when leadership concentrates in 1-2 sectors with high conviction (>60% breadth), not when 5-6 sectors are ‘mixed positive’. Concentration tells you institutions are taking active positions; broad mixed signals tell you flows are passive index buying. Today’s spread suggests current sector bias.
Reviewed by analyst before publication. Analysis based on publicly available primary sources.
Frequently Asked Questions
Which sector is currently leading the market according to the weekly scorecard?
The Technology sector (XLK) is the clear leader, posting a 6.4% weekly gain and a 19.8% monthly gain. This performance is currently classified as ‘ACCUMULATION’ by our flow signal.
Why is the Energy sector (XLE) lagging behind?
Energy is in a ‘DISTRIBUTION’ phase with a 6.2% decline over the past week and a 11.8% drop from its 52-week high. Institutional capital is rotating out of cyclical commodity sectors and into technology.
Does the current sector rotation align with the EXPANSION macro regime?
The rotation is mixed; while the EXPANSION regime suggests overweighting tech and cyclicals, the market is currently ignoring materials and industrials. This suggests that the current rally is driven more by secular growth preferences than by broad economic cyclicality.
📚 Related Articles
- PROG Holdings (PRG) +24.1% After Earnings Report — Is the Move Sustainable?
- EPS Estimates Explained: How Earnings Beats and Misses Actually Move Stocks
- Kforce (KFRC) +43% After Earnings Beat — Key Levels and Follow-Through Setup
- Omnicell (OMCL) +21% on Earnings Beat — What the Numbers Actually Show
- AAON (AAON) +44% After Guidance Raise — Updated Bull Case and Key Levels
Explore the Earnings & Reactions Playbook
This article fits into our Earnings & Reactions topic cluster and is meant to serve sector outlook.
Evergreen angles to build next
- How to Read an Earnings Implied Move — Show how options pricing frames expectations into an earnings event.
- Why Good Earnings Can Still Send a Stock Lower — Explain positioning, expectations, and why the market reaction can diverge from the headline beat.
- How to Judge Catalyst Quality — Separate confirmed catalysts from weak headline narratives, flow-only moves, and low-conviction tape action.
Cluster-adjacent reads
Earnings Reaction Playbook
A hub for reading expectation gaps, implied moves, guidance tone, and post-earnings price action.
Suggested reading path
- Read the implied move explainer first
- Then study good-results/bad-reaction setups
- Use fresh preview articles as live case studies
Core evergreen guides in this hub
- How to Read an Earnings Implied Move — Show how options pricing frames expectations into an earnings event.
- Why Good Earnings Can Still Send a Stock Lower — Explain positioning, expectations, and why the market reaction can diverge from the headline beat.
- How to Judge Catalyst Quality — Separate confirmed catalysts from weak headline narratives, flow-only moves, and low-conviction tape action.
Glossary anchors: implied move, guidance, beat rate, expectation gap
This analysis is provided for educational and informational purposes only. It is not investment advice. Consult a qualified financial advisor before acting on any information presented here.


