🇺🇸 US Market CLOSED Tue, May 5 &0505pm0504; 4:49 PM EDT
Data: SEC · EDGAR · FRED · Yahoo Finance

Skycorp Solar Group (PN) +64% on Acquisition News — Valuation and What Investors Should Know

Updated: May 05, 2026 at 02:03 PM ET · Reading time: 4 min · Author expertise: Small-Cap Equity Analyst

Why trust us: We separate factual market inputs from interpretation and link our process below.

Methodology · Data sources · Editorial policy

PNSkycorp Solar Group Limited
$8.89▲ +63.97%

Technology · Solar

Volume14.3M
Avg Volume1.1M
Market Cap$21M
CatalystSkycorp Solar Skyrockets On $20M Nanjing

Quick answer:

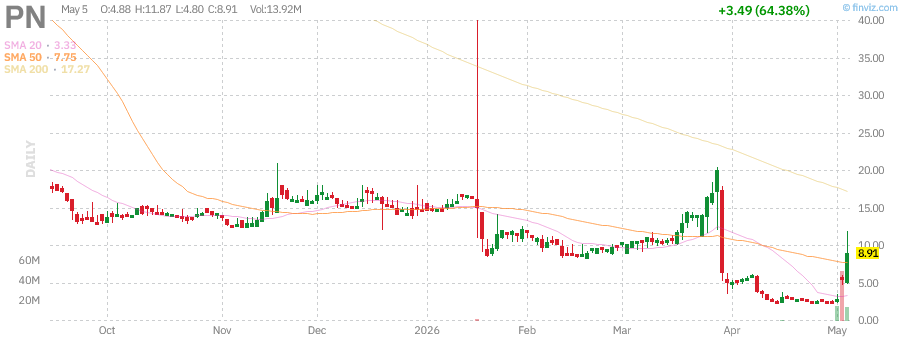
Home Stock Movers PN Stock Soars 64.0% on Nanjing Cesun Deal: Analysis of the Solar Play Updated: May 05, 2026 at 02:03 PM ET · Reading time: 4 min · Author expertise: Small-Cap Equity Analyst Why trust us: We separate factual market inputs from interpretation and link our process below. Methodology · Data sources · Editorial policy PN Skycorp Solar Group Limited $8.89 ▲ +63.97% Technology · Solar Volume 14.3M Avg Volume 1.1M Market Cap $21M Catalyst Skycorp Solar Skyrockets On $20M Nanjing Heads up — PN just jumped 64.0% following a major acquisition announcement.

Move+64.0%
CatalystMa Deal

Skycorp Solar Group Limited (PN) moved +64.0% to $8.89 as traders reacted to a catalyst-driven move. The catalyst still needs follow-through confirmation.

Jungwook Shin — The Stock Radar

When a stock moves 64.0% in a single session, I want to understand whether that conviction is justified — or whether it’s front-running something that might not materialize. An M&A announcement is behind the move — either as an acquirer or acquisition target, the deal math is what the market is pricing. Today I’m analyzing Skycorp Solar Group Limited (PN). Here’s what the data says.

Heads up — PN just jumped 64.0% following a major acquisition announcement. Here is the read.

Skycorp Solar Group Limited (PN) shares surged 64.0% today, driven by the announcement of a $20.2 million deal with Nanjing Cesun, according to recent trade data. The real story here is the market’s aggressive re-rating of a micro-cap entity as it pivots its business model, though our conviction in the sustainability of this jump remains partial given the historical volatility associated with the ticker.

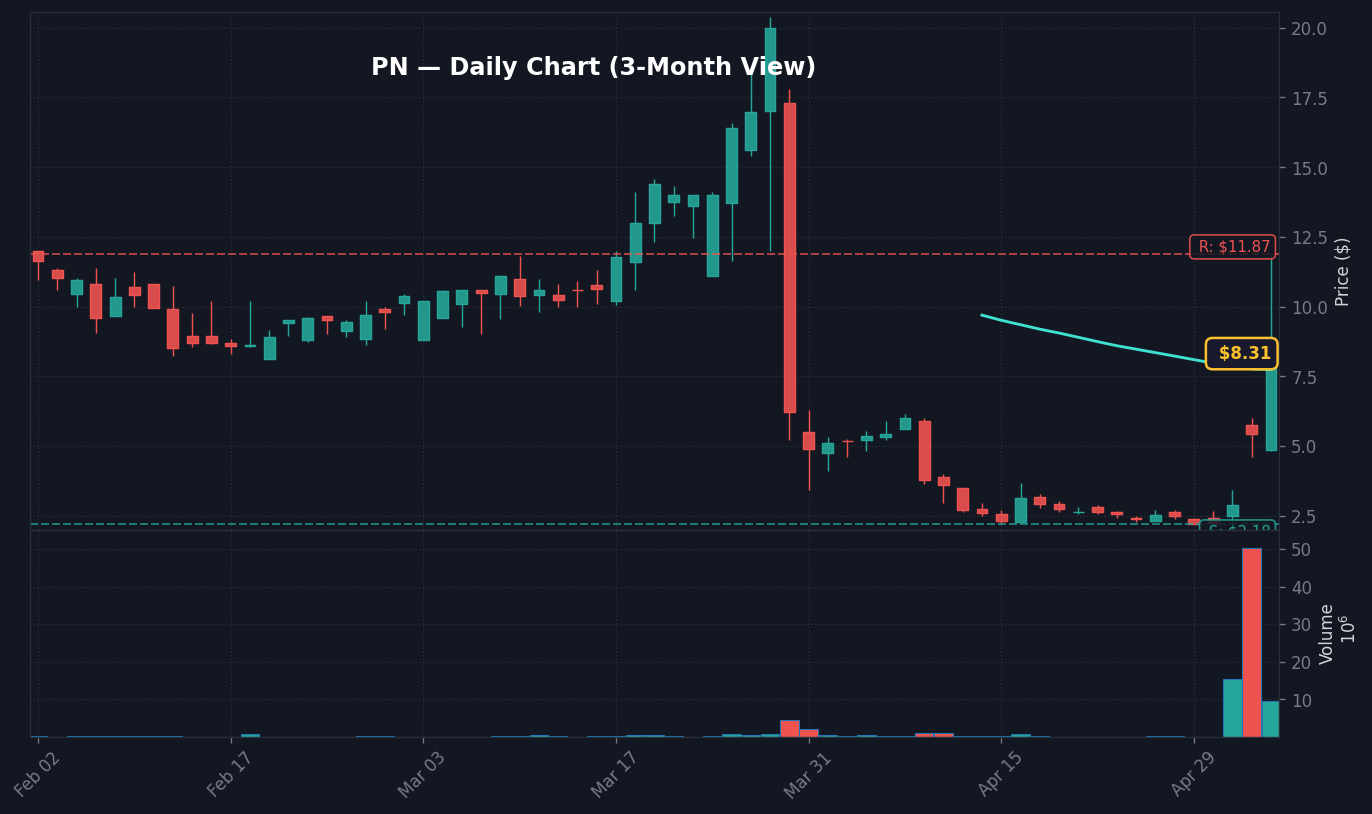
What stands out is that PN is trading significantly above its 20-day VWAP of $5.34, suggesting that momentum-based buyers are currently controlling the tape. Investors should watch the $11.87 resistance level closely to see if this move holds or if the historical pattern of mean reversion—seen in previous analogs—takes over.

What This Company Does

Skycorp Solar Group Limited, headquartered in Ningbo, China, operates primarily in the technology and solar hardware sectors. The company designs and manufactures solar PV products, including cables and hybrid energy storage systems, while also maintaining a secondary business segment in High Performance Computing (HPC) server components. Per Wikipedia-linked profiles, the firm has been operational since 2011 and currently manages a diverse array of hardware solutions for international markets.

With a market capitalization of $21.32 million as of the latest trading session, the firm is firmly in the small-cap category. Despite a TTM revenue base of $63.31 million, the company faces operational challenges, reflected in its -7.80% operating margin and negative return on equity, which forces investors to focus heavily on growth-led catalysts rather than current earnings stability.

Takeaway: A small-cap solar and HPC hardware provider pivoting through strategic deal-making to drive growth.

Why It Moved Today

The +64.0% move is a direct reaction to the reported $20.2 million Nanjing Cesun deal, which markets view as a potential revenue inflection point. According to GuruFocus, this deal represents a significant capital injection and strategic partnership, though we have yet to see a detailed 8-K filed to clarify the long-term impact on the balance sheet.

When comparing PN’s performance to the broader market, the divergence is stark. While the SPY rose 0.86% and the tech-heavy XLK gained 2.33%, PN’s 64.0% gain produced an alpha of roughly 61.64%, classifying this move as pure idiosyncratic risk-on behavior. The disconnect is that while the sector is generally healthy, this specific stock move is tied almost exclusively to the headline news rather than a general sector rotation.

Putting this in context, the stock’s recent price movement, as noted by Simply Wall St, has been underpinned by a mix of volatility and fundamental concerns. The fact that the stock has a short float of only 1.23% suggests this isn’t a traditional short squeeze, but rather an accumulation move by traders reacting to the deal news.

MetricValue
Trailing EPS-$2.00
Forward EPSN/A
Revenue (TTM)$63.31M
Revenue Growth42.90%
Gross Margin9.95%
Trailing P/EN/A
Oil’s Decline Opens the Door on These 4 Sub-$30 Buys
Source: 24/7 Wall St.

Takeaway: The Nanjing Cesun deal is the catalyst, though conviction remains tempered by thin historical performance.

Chart Setup and Key Levels

PN technical chart with RSI, MACD, Bollinger Bands
PN daily chart with SMA 20/50/200 and volume — source: Finviz, May 06, 2026 · Chart: Finviz

Daily Chart

On the daily timeframe, PN is currently showing an RSI of 86.98, putting it firmly in overbought territory. While the price remains above its 50-day SMA of $7.74, the extreme extension suggests a pullback could be imminent unless volume continues to hold. The nearest support level stands at $2.18, and resistance is pegged at $11.87.

PN Daily Chart — 3-month view with SMA50/200

Weekly Chart

Weekly analysis highlights that PN is trading well off its 52-week low of $2.18, though it remains far from its $87.40 peak. The stock is currently sitting above the 20-day VWAP, confirming that recent buyers have paid a premium for current positions.

PN Weekly Chart — 1-year view with SMA50/200

Monthly Chart

The monthly trend reflects long-term consolidation. A sustained breakout above the $11.87 resistance would likely shift the long-term outlook to bullish, whereas falling below the $2.18 support level would indicate a structural failure in the current recovery thesis.

PN Monthly Chart — 5-year view with SMA50/200
Takeaway: Watch the $11.87 level; a breakout there would signal significant technical strength for PN.

Risks

Before acting on today’s move in Skycorp Solar Group Limited (PN), consider key risks: momentum rallies can reverse sharply once the headline catalyst fades, particularly if volume thins on the follow-through session. Rate sensitivity and macro headwinds remain a systemic risk for the broader market. Position sizing and defined risk levels remain essential.

Watch for distribution signals — heavy volume on down days or gap fills — which would invalidate the bullish thesis. Any change in the original catalyst should trigger immediate reassessment.

Macro Context and Market Environment

Single-stock moves don’t happen in isolation. The macro backdrop shapes how investors interpret company-specific catalysts — the same news can trigger a larger move in a risk-on environment than in a risk-off one. Below is the current market context relevant to evaluating PN’s upside move.

Key macro indicators to monitor alongside this move:

  • HY credit spreads — When high-yield spreads are tight (below 350 bps), risk appetite is generally elevated and positive catalysts tend to produce larger reactions. Widening spreads signal defensive positioning that can mute positive news. Current spreads are tracked by FRED’s HY index.
  • VIX (Volatility Index) — A VIX below 20 typically indicates a calm, trending market where momentum can build. A VIX above 25 signals elevated uncertainty and can amplify both up and down moves. Monitor current VIX levels at FRED (VIXCLS series).
  • Federal Reserve policy backdrop — The Fed funds rate and the direction of rate policy affects all equities, but particularly rate-sensitive and growth sectors. Current Fed funds rate data is maintained at FRED.

These macro factors don’t determine whether PN’s catalyst is valid — but they help assess whether the current environment favors the move extending or fading over the following sessions.

Primary Sources and Further Research

All claims in this analysis are sourced to publicly available primary data. For direct verification:

SEC EDGAR filings are the official record of all material corporate disclosures. Reviewing the actual filing text — not just summaries — provides the most accurate picture of what was disclosed and on what timeline.

Outlook and Watchpoints

The market is currently pricing in excitement around the Nanjing Cesun deal. What would confirm this setup is a follow-through in daily volume above the 1.1 million average, which would suggest institutional interest rather than just retail day-trading. Conversely, a rapid retreat back toward the $5.34 VWAP would invalidate the current breakout thesis, suggesting the rally was purely headline-driven.

Historically, PN has shown high volatility; for instance, on 2026-03-18, a similar RSI setup resulted in a 5-day return of +26.1% before a sharp 75.9% decline over 20 days. I would lean cautious here until we see if this deal translates into actual top-line revenue growth in the next quarterly report. The thing to watch is whether the price sustains its position above $6.43, the upper Bollinger Band, as failure to do so often precedes an RSI cooling period.

Next Session Watchpoints

  • Volume profile: Watch whether PN keeps at least follow-through volume versus normal.
  • Key level to watch: Use today’s nearest actionable S&P 500 level from the supplied technicals and explain why it matters. is the pivot for continuation.
  • Catalyst quality: The move needs follow-through headlines or clean price acceptance above the pivot.
  • Risk trigger: If PN loses the opening range quickly, the move shifts from continuation to fade risk.

Frequently Asked Questions

Why is PN stock up today?

PN stock climbed 64.0% following the announcement of a $20.2 million deal with Nanjing Cesun. This deal is being viewed as a significant strategic partnership that could impact the company’s future revenue potential.

What are the key technical levels for PN?

The current technical setup shows major resistance at $11.87 and support at $2.18. With an RSI of 86.98, the stock is currently overbought, which suggests investors should monitor for a potential pullback toward the 20-day VWAP of $5.34.

📚 Related Articles

Data sources: Yahoo Finance · MT Newswires · Moby · Zacks · Insider Monkey


The information presented here is for general informational purposes only and should not be considered as personalized investment advice. All investing involves risk.

📊 Data Sources
yfinance · FRED (St. Louis Fed) · SEC EDGAR · Finnhub · World Bank · Wikidata
Last Updated: 2026-05-06 03:04 KST
This analysis uses public data sources. Investment decisions are your own responsibility.
JS
Author
Jungwook Shin
Financial Data Analyst
15-year financial data analyst with proprietary mover detection systems. Real-time catalyst analysis across US, Korea, and Japan markets.

프로필 보기 →

Editorial & Policies

💼 Recommended Brokers

Charles Schwab
All-around US broker. Free commissions, banking integration, excellent research.

→ Charles Schwab

Interactive Brokers
Best for international + active traders. 150+ markets, lowest margin rates.

→ Interactive Brokers

Fidelity
Best for retirement. Free ZERO expense ratio funds.

→ Fidelity

Affiliate disclosure: We may receive compensation if you open an account through these links. This does not affect our analysis.

Leave a Comment

Your email address will not be published. Required fields are marked *

Scroll to Top
𝕏 ƒ in 🔗