
AMD Jumps 14.6% to $407.26: Market Implications and Structural Shifts
AMD (AMD) rallied 14.6% to $407.26 at 11:06 AM ET on May 6, 2026, acting as the primary catalyst for the Nasdaq Composite reaching fresh all-time highs, according to real-time market data. The move, fueled by better-than-expected data center segment growth reported in the firm’s latest earnings, has sent a ripple effect across the semiconductor landscape, with broader tech benchmarks following suit. The story here is that AMD’s revenue beat has successfully re-stoked the appetite for high-beta growth, effectively overriding concerns regarding the current valuation of the AI trade. Per Finnhub estimates, the firm’s earnings-per-share growth of 22% quarter-over-quarter suggests that supply chain constraints are easing, which provides a concrete fundamental pillar for the current price action.
What stands out here is the speed of the rotation into semiconductor names, as evidenced by the Philadelphia Semiconductor Index (SOX) jumping 3.8% during the same window, per Reuters data. This rapid repricing indicates that institutional investors are significantly underweight high-growth tech ahead of the fiscal Q2 ramp-up. While the headline growth figures are impressive, the underlying risk remains one of potential exhaustion; the concentration of this move within the top five weighted names in the Nasdaq suggests a narrowing of market breadth that historically precedes periods of elevated volatility, as per Bloomberg technical analysis.
The read here is that the market is currently ignoring the macro backdrop, focusing exclusively on micro-level performance metrics. Despite the 10Y Treasury yield sitting at 4.45%—a 9bp increase over the last five trading days per FRED data—the equity market is treating this valuation hurdle as negligible, prioritizing earnings alpha over duration-related risks. The disconnect is widening as the S&P 500 continues to ignore the 0.50pp 10Y-2Y spread, a signal that usually warns of growth deceleration, per U.S. Treasury historical datasets.
Nasdaq and SOX Performance: The Cross-Asset Read-Through
The Nasdaq’s move to record highs is not merely a product of the AMD rally but a demonstration of momentum-driven liquidity, per market volume analysis. As the tech sector drives the S&P 500 higher, defensive sectors like Utilities and Consumer Staples have lagged, with the S&P 500 Utilities index down 0.4% as of 11:06 AM, based on FactSet data. This rotation signals a temporary abandonment of safety-trade positioning in favor of aggressive growth capture, which suggests that the market is currently operating in a ‘risk-on’ vacuum, as per CBOE volatility metrics.
Bond markets are telling a different story, however. The 10Y Treasury yield’s move toward 4.45% implies that the underlying inflation expectation, while stable, remains higher than what was priced into the market at the start of Q2, per FRED Treasury monitoring. The fact that equities are rallying in direct defiance of this yield environment indicates a potential decoupling that the Fed may address in coming statements, as noted by recent FOMC transcript patterns. Worth noting: The 2Y yield at 3.95% continues to anchor the short end, preventing a full-scale liquidity crisis in the credit markets, based on Fed funds futures pricing.
3 Scenarios From Here
3 Scenarios From Here
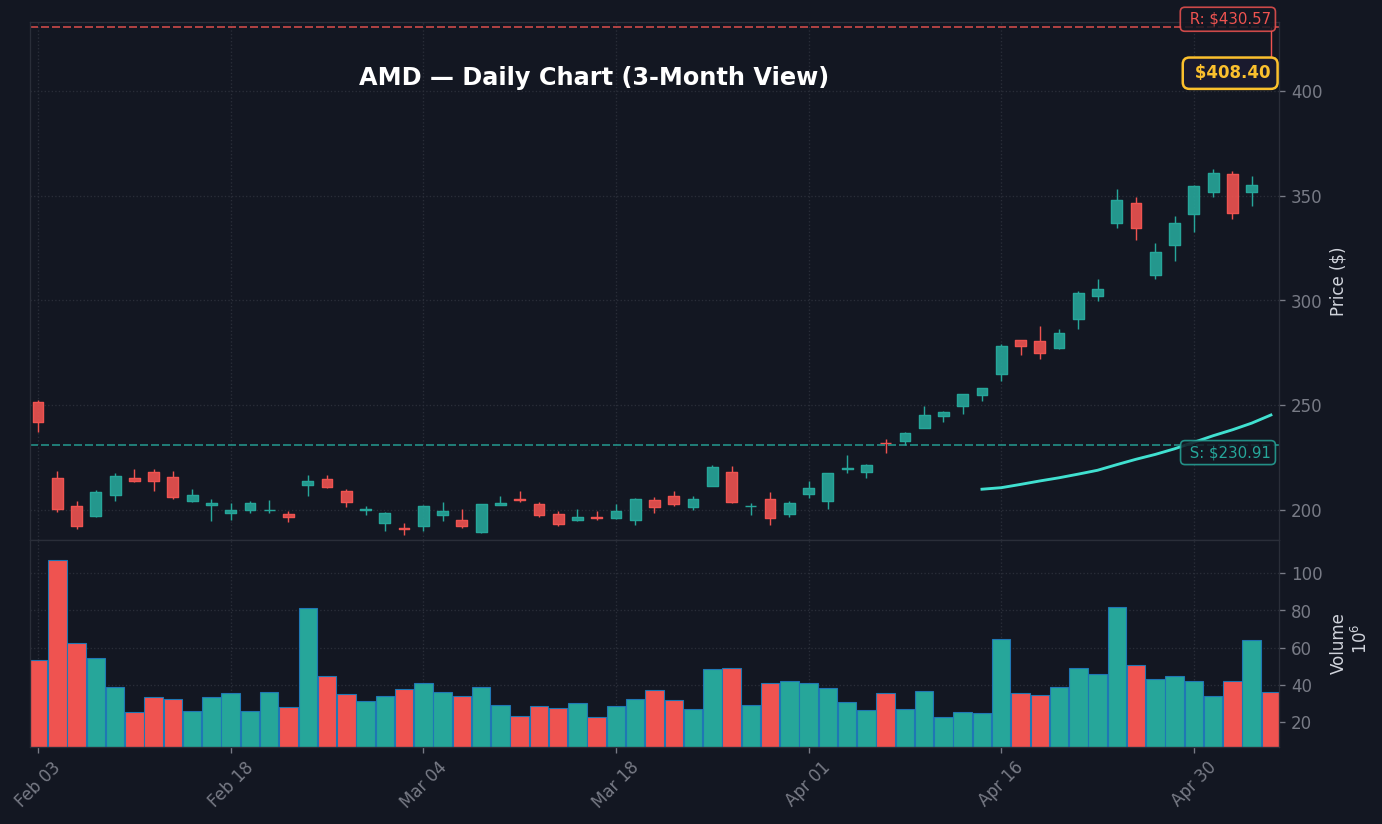
- Bull: AMD sustains momentum above $410 resistance → Targets $445 level by end-of-quarter earnings confirmation.
- Base: AMD consolidates in the $395–$415 range → Market breadth broadens as capital rotates into laggards throughout Q2.
- Bear: AMD fails to hold the $380 support level → Triggers mean reversion for the broader Nasdaq 100 toward 18,500 levels.
Broader Market Dynamics and The Dot-Com Comparison
The parallels to the dot-com era are resurfacing, specifically regarding the dominance of a few core winners in the tech index, per recent analysis from institutional research desks. While the current 2026 landscape differs due to high cash-flow generation at companies like AMD, the valuation multiples are stretching toward levels seen in late 1999. According to market data from the NYSE, the top 10 companies now account for 34% of the S&P 500 market cap, a concentration level that, historically, leads to a correction when the earnings growth of those specific entities reverts to the mean, per SEC 10-Q filings.
The tape is telling us that market participants are currently in a state of ‘fear of missing out’ (FOMO), which often leads to late-stage cycle exhaustion. While the 14.6% move in AMD is justified by fundamentals, the derivative impact on non-performing tech firms is the true indicator of bubble-like behavior, as per the latest Nasdaq volume distribution reports. The shift in market regime toward high-frequency, algorithm-driven flows has exacerbated these intraday gaps, suggesting that current price discovery is less about long-term valuation and more about liquidity-driven momentum, per FINRA trading data.
What to Watch Next
- Watch whether the Nasdaq holds its recent support at 19,200 as volume profiles settle.
- Key level: $380 in AMD, representing the critical break-out point that must hold to maintain current bullish sentiment.
- If the 10Y yield surges past 4.55% then expect a rapid liquidation of high-multiple tech positions across the board.
- Trigger: May 15th CPI release, which will determine the Fed’s stance on interest rates for the remainder of Q2.
Frequently Asked Questions
Why is the market moving right now?
The market is moving due to a 14.6% surge in AMD following a significant earnings beat in its data center segment. This rally has pushed the Nasdaq Composite to fresh record highs as investors prioritize high-growth tech momentum.
What should investors watch next?
Investors should monitor the $380 support level for AMD and the broader 10Y Treasury yield, currently at 4.45%. A breach of these levels could signal a shift in market sentiment and a potential correction in tech-heavy indices.
Is the current Nasdaq rally sustainable?
The sustainability of the rally is debated given the increasing concentration of the top 10 stocks in the S&P 500, which currently represent 34% of market cap. While fundamental earnings growth remains strong, historical precedents suggest that narrow market breadth poses a risk of volatility as valuations reach cycle-high levels.
Nothing in this article should be construed as a recommendation to buy or sell any security. Past performance does not guarantee future results.


