
What happened:
Home Stock Movers HIMX Stock Surges 37.5% on Q1 Earnings Beat: The Real Story Updated: May 07, 2026 at 09:58 AM ET · Reading time: 5 min · Author expertise: Small-Cap Equity Analyst Why trust us: We separate factual market inputs from interpretation and link our process below. Methodology · Data sources · Editorial policy 💼 Earnings Whisper & Guidance Context Quarter Est EPS Actual EPS Surprise 2026-03 $0.05 $0.05 ✓ Beat (+8.9%) 2025-12 $0.04 $0.04 ✓ Beat (+0.8%) 2025-09 $0.04 $0.01 ✗ Miss (-85.3%) 2025-06 $0.10 $0.10 ✗ Miss (-6.9%) 📅 Next Earnings: 2026-08-05 TBD · EPS estimate: $0.06 · Revenue estimate: $213M Data: Finnhub.
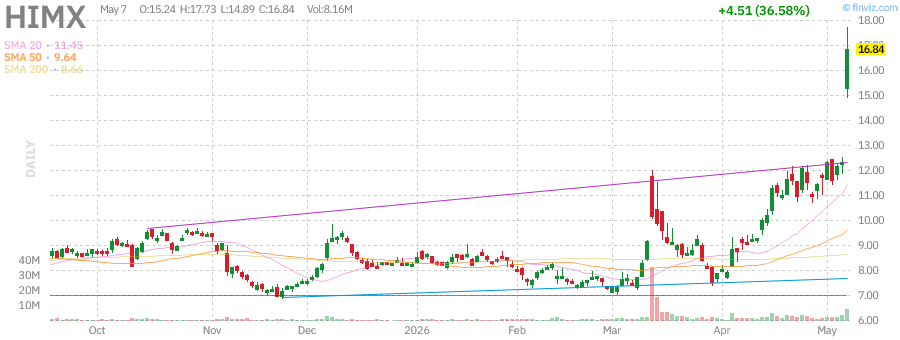
Himax Technologies, Inc. (HIMX) moved +37.5% to $16.96 as traders reacted to a catalyst-driven move. The catalyst still needs follow-through confirmation.
Jungwook Shin, The Stock Radar
A 37.5% single-session move is worth taking seriously. Most of the time, a move this size has a specific, traceable cause. Himax Technologies, Inc. (HIMX) caught my attention today. The move follows a quarterly earnings beat — the company reported results that exceeded Wall Street’s consensus estimates. Here’s my read on what happened and what comes next.
Himax Technologies, Inc. (HIMX) just vaulted 37.5% higher; here is the breakdown of why the market is reacting to the latest Q1 results.
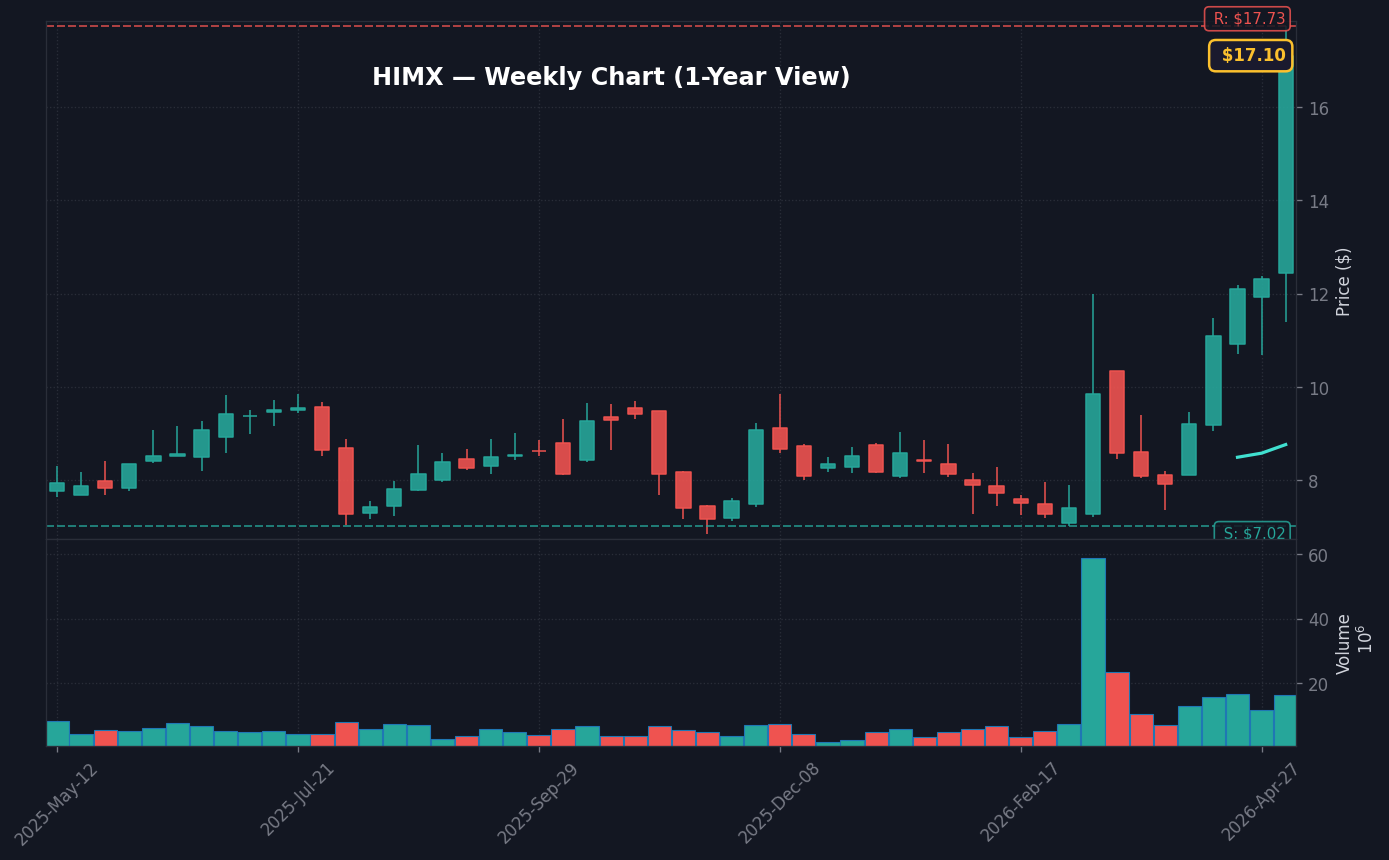
Himax Technologies, Inc. (HIMX) shares moved +37.55% today as traders reacted to a confirmed earnings beat in the company’s Q1 financial report. The primary driver of this volatility is the company’s ability to outperform sales expectations, which triggered a significant re-rating in a sector often sensitive to semiconductor cycle shifts. My conviction here is partial, as while the revenue surprise is tangible, we must weigh the immediate price-action spike against the company’s long-term 14.4% YoY revenue decline.
The market is currently pricing in a shift in momentum for the driver IC segment. While the broader S&P 500 (+0.05%) and Nasdaq (+0.26%) remained relatively flat during the session, HIMX showed clear idiosyncratic strength, outperforming the XLK technology sector ETF by over 37%. This divergence suggests that the move is less about a broad risk-on regime and more about specific institutional positioning following the earnings release.
What This Company Does
Himax Technologies, Inc. is a fabless semiconductor company headquartered in Tainan City, Taiwan, that specializes in display imaging processing technologies. Per the company IR portal, the business operates across two core segments: Driver IC and Non-Driver Products. They provide display driver integrated circuits (ICs) and timing controllers for a vast range of end-use applications, including television screens, PC monitors, mobile phones, laptops, and automotive displays. Per Wikipedia, the company was established in 2001 and has grown into a significant player in the global semiconductor supply chain, employing 2,238 staff members as of their last major filings.
Beyond standard display drivers, the company manufactures power management ICs, OLED drivers, and specialized ultra-low-power “WiseEye” smart image sensing products. Their technical moat often centers on their ability to integrate touch and display technologies for automotive and industrial partners. With a market capitalization of roughly $3.03 billion, the company balances its legacy driver business with high-growth aspirations in 3D sensing and LCoS microdisplays, though these areas face stiff competition in the current macroeconomic environment.
Why It Moved Today
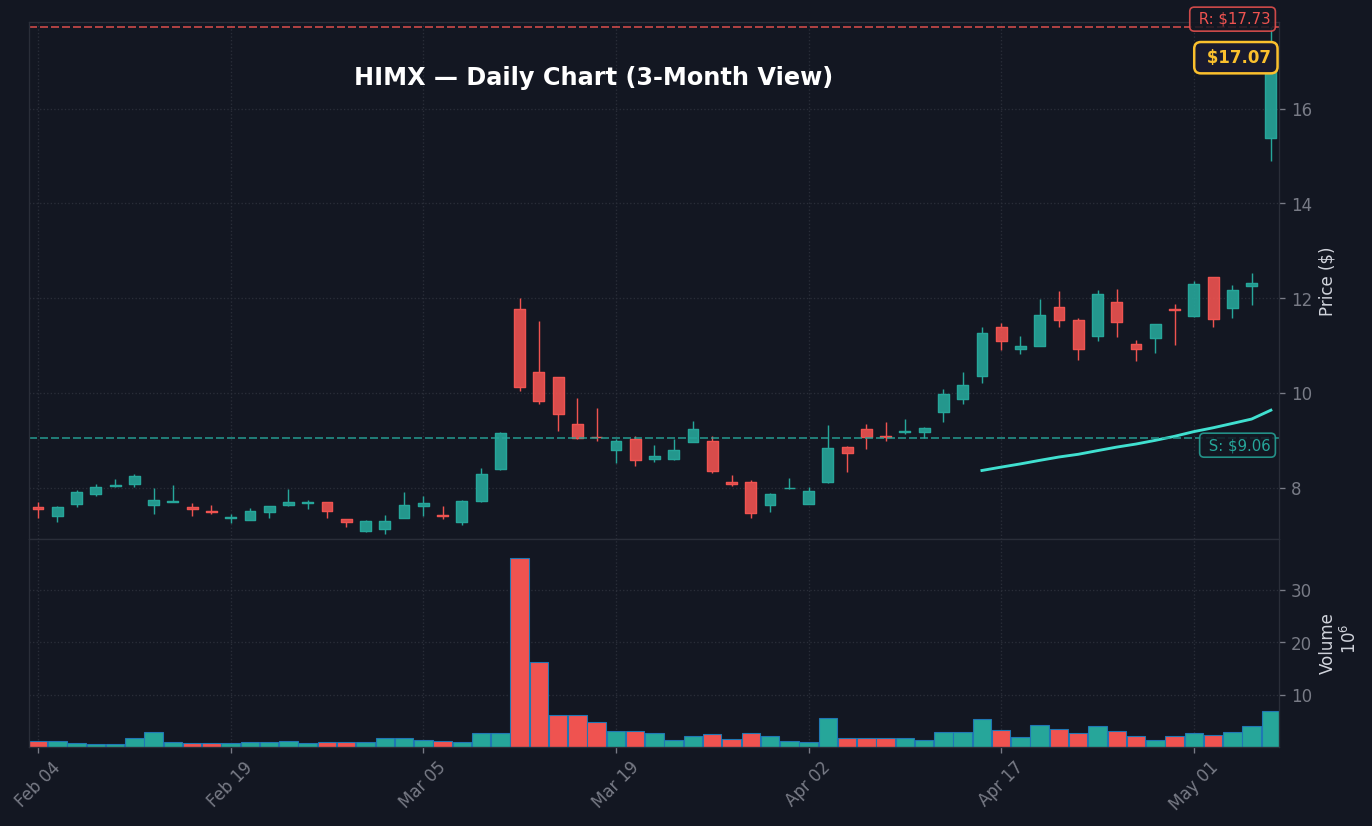
The 37.55% surge today is directly tied to the Q1 sales report, which arrived with an earnings beat that outperformed analyst expectations. The company reported EPS of $0.05 against estimates of $0.0459, marking an 8.9% surprise to the upside. This performance is notable because it follows a series of recent misses, including an 85.3% earnings miss in Q3 2025. According to reports from StockStory, this beat served as the immediate catalyst for the sharp price action and elevated volume we observed in today’s tape.
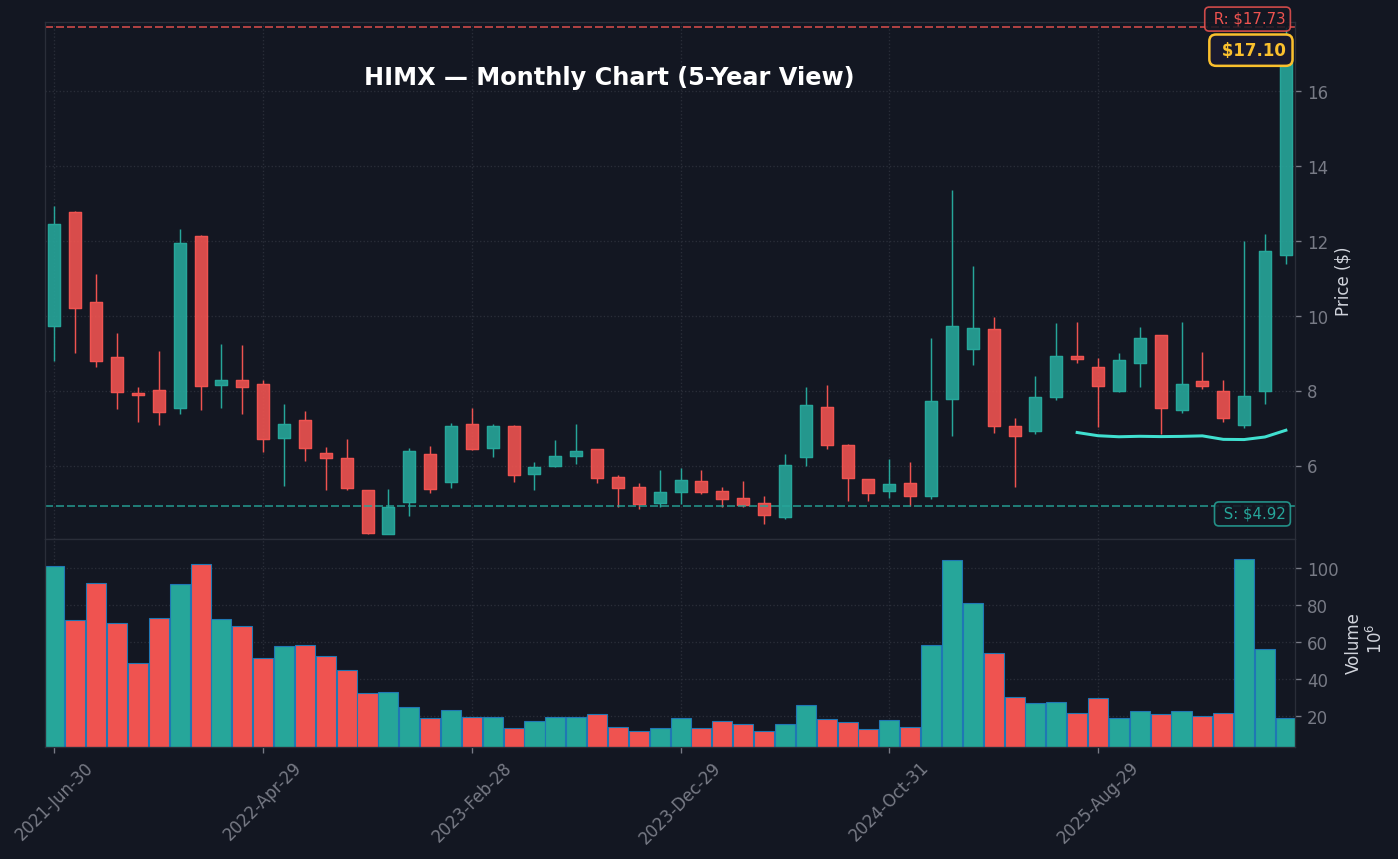
What stands out here is the divergence from the small-cap index (IWM), which fell 0.67% during the same window. The +37.44% alpha compared to the S&P 500 indicates this is a pure idiosyncratic move rather than a general sector rotation. I’d lean toward caution, however; while the current RSI (14) of 76.67 places the stock in overbought territory, historical analogs from 2021/2022 show that similar RSI/volume spikes have occasionally led to sharp 5-day retracements, sometimes exceeding 20%. The market is reacting to the immediate headline numbers, but the sustained trend will depend on whether this Q1 result represents a bottoming of the annual revenue decline of 14.4%.


 +21% on Earnings Beat — What the Numbers Actually Show")