🇺🇸 US Market CLOSED Tue, Apr 28 &0428pm0504; 4:35 PM EDT
Data: SEC · EDGAR · FRED · Yahoo Finance

OMCL Stock Analysis: What’s Driving Today’s Big Move?

Updated: April 28, 2026 at 09:52 AM ET · Reading time: 4 min · Author expertise: Small-Cap Equity Analyst

Why trust us: We separate factual market inputs from interpretation and link our process below.

Methodology · Data sources · Editorial policy

OMCLOmnicell, Inc.
$45.67▲ +21.36%

Healthcare · Health Information Services

Volume305K
Avg Volume651K
Market Cap$2.1B
CatalystOmnicell Inc (NASDAQ:OMCL) Surges 12% Pr

What happened:

Home Stock Movers Why OMCL Stock Jumped 21.4% — Q1 Earnings Beat and Revenue Growth Analysis Updated: April 28, 2026 at 09:52 AM ET · Reading time: 4 min · Author expertise: Small-Cap Equity Analyst Why trust us: We separate factual market inputs from interpretation and link our process below. Methodology · Data sources · Editorial policy 💼 Earnings Whisper & Guidance Context Quarter Est EPS Actual EPS Surprise 2026-03 $0.33 $0.55 ✓ Beat (+67.8%) 2025-12 $0.51 $0.40 ✗ Miss (-21.0%) 2025-09 $0.37 $0.51 ✓ Beat (+37.9%) 2025-06 $0.27 $0.45 ✓ Beat (+68.6%) 📅 Next Earnings: 2026-04-28 Before Market Open · EPS estimate: $0.33 · Revenue estimate: $310M Data: Finnhub.

Move+21.4%
CatalystEarnings Beat

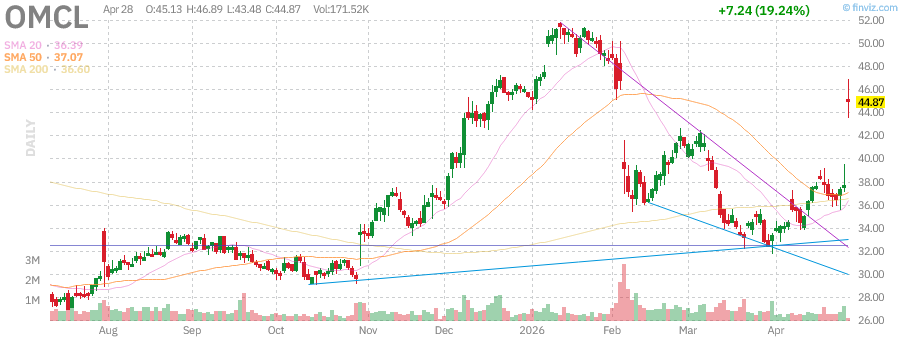
Heads up — Omnicell (OMCL) just popped 21.4% on a strong Q1 earnings beat. Here is the read on the move and what it means for the stock.

Omnicell, Inc. shares surged 21.4% today, driven by a decisive Q1 earnings beat where the company reported diluted EPS of $0.55 against analyst estimates of $0.3277, representing a 67.8% positive surprise. Our conviction in this move is partial; while the earnings print is objectively strong, the current macro regime—with a 3.64% Federal Funds Rate and a 10Y Treasury yield hovering at 4.31% per FRED data—creates a challenging environment for high-multiple healthcare information services firms. We are watching to see if this move can sustain momentum through the remainder of the week.

What stands out here is the stock’s decoupling from the broader market. While the S&P 500 dipped 0.41% and the Nasdaq 100 retreated 0.78%, OMCL shares provided significant alpha of +21.94% against the broader index. This signals that today’s move is a pure idiosyncratic event centered on company-specific fundamentals rather than broader sector sentiment, even as the Health Care Select Sector SPDR (XLV) managed a modest 0.53% gain.

What This Company Does

Omnicell, Inc. (NASDAQ: OMCL) is a $2.06B market-cap company headquartered in Fort Worth, TX, operating within the Health Information Services industry. The firm focuses on the digital transformation of the medication management process, providing automated dispensing systems for hospitals and patient care areas. Per company disclosures, its solutions range from the Titan XT automated dispensing cabinet to cloud-based platforms like OmniSphere, which aim to reduce clinical errors and optimize pharmacy workflows.

Per Wikipedia, Omnicell also maintains a footprint in retail and community pharmacy digital enablement through its EnlivenHealth platform. With 3,580 employees, the company acts as a critical infrastructure provider for large-scale health systems in the United States and international markets. The firm’s business model depends on deep integration into hospital pharmacy supply chains, which provides recurring service and maintenance revenue.

Takeaway: Omnicell provides critical automated medication management technology for hospitals and large-scale pharmacy systems globally.

Why It Moved Today

The primary catalyst for today’s 21.4% surge is the Q1 earnings release, which showed a significant beat on both EPS and top-line revenue estimates. The company’s ability to outperform its $0.3277 EPS expectation by nearly 68% caught the market off guard, especially after the previous Q4 miss. According to the 8-K filed 2026-04-28, the operational efficiency improvements are beginning to show in the margins, as reflected by the current 42.88% gross margin.

Our read on the durability of this move remains cautious. The stock’s current RSI of 81.15 confirms that shares are in heavily overbought territory. Furthermore, with short interest sitting at 6.7% of float and 5.4 days-to-cover, today’s move likely triggered a short squeeze, amplifying the price action. We lean toward the view that this is a volatility event triggered by a catalyst that requires follow-through buying to avoid a mean reversion.

MetricValue
Trailing EPS$0.04
Forward EPS$2.12
Revenue (TTM)$1.18B
Revenue Growth2.30%
Gross Margin42.88%
Trailing P/E1134.13
Omnicell (OMCL) Q1 Earnings and Revenues Surpass Estimates
Source: Zacks

Takeaway: A strong earnings beat fueled a 21.4% gain, likely compounded by short-covering activity.

Chart Setup and Key Levels

OMCL technical chart with RSI, MACD, Bollinger Bands
OMCL daily chart with SMA 20/50/200 and volume — source: Finviz, April 28, 2026 · Chart: Finviz

Daily Chart

The daily technical setup for OMCL reflects extreme momentum. With an RSI of 81.15, the stock is technically overbought, suggesting that the recent 21.4% run may be prone to a brief pause or profit-taking. Price is well above the 50-day SMA of $37.09 and currently trading outside the upper Bollinger Band of $41.76, confirming a aggressive breakout move. The nearest resistance is located at the 20-day high of $46.89.

OMCL Daily Chart — 3-month view with SMA50/200

Weekly Chart

From a weekly perspective, the stock is attempting to break away from its recent consolidation range. The 60-day support at $31.75 remains the crucial floor for the long-term trend. While the 5-day momentum is up 24.5%, investors should recall that in historical analogs, such as 2026-01-13 where the RSI hit 80.9, the 20-day forward return was -26.4%, suggesting caution in chasing this vertical move.

OMCL Weekly Chart — 1-year view with SMA50/200

Monthly Chart

On the monthly timeframe, OMCL is testing the upper bounds of its historical trading channel. To confirm a sustainable new trend, the stock needs to hold above the VWAP level of $36.29. If it fails to sustain the breakout, the stock could retreat toward the 20-day support at $31.75, which would invalidate the current breakout momentum.

OMCL Monthly Chart — 5-year view with SMA50/200
Takeaway: The stock is heavily overbought with key support sitting at $31.75.

Outlook and Watchpoints

Moving forward, the focus shifts to whether OMCL can consolidate above the $40 level without triggering an RSI-driven pullback. A successful test of the $46.89 resistance level would demonstrate institutional accumulation, but we would want to see sustained volume above the 650K average to validate this breakout. If the stock manages to flip its current resistance into support, the path toward the consensus analyst target of $57.43 becomes more plausible.

On the downside, failing to hold the $36.29 VWAP would derail this setup and likely attract sellers who are looking to realize profits after the 21% gap up. The macro environment, characterized by sticky inflation and a 3.3% CPI print as of March 2026, could pressure high-beta stocks if the 10Y yield surges beyond 4.35%. Not investment advice; this is for informational purposes only.

Risks

Before acting on today’s move in Omnicell, Inc. (OMCL), consider key risks: momentum rallies can reverse sharply once the headline catalyst fades, particularly if volume thins on the follow-through session. Rate sensitivity and macro headwinds remain a systemic risk for the broader market. Position sizing and defined risk levels remain essential.

Watch for distribution signals — heavy volume on down days or gap fills — which would invalidate the bullish thesis. Any change in the original catalyst should trigger immediate reassessment.

Next Session Watchpoints

  • Volume profile: Watch whether OMCL keeps at least follow-through volume versus normal.
  • Key level to watch: Use today’s nearest actionable S&P 500 level from the supplied technicals and explain why it matters. is the pivot for continuation.
  • Catalyst quality: The move needs follow-through headlines or clean price acceptance above the pivot.
  • Risk trigger: If OMCL loses the opening range quickly, the move shifts from continuation to fade risk.

Frequently Asked Questions

Why is OMCL stock up today?

OMCL stock jumped 21.4% due to a strong Q1 earnings report, where the company beat analyst EPS estimates by 67.8%. The positive surprise acted as the primary catalyst for the price surge.

Is Omnicell’s current price sustainable?

With an RSI of 81.15, the stock is currently in overbought territory, which often precedes a cooling-off period. While the earnings beat is fundamentally positive, investors should be cautious given historical data showing significant retracements after similar RSI spikes.

📚 Related Articles

Data sources: Yahoo Finance · Motley Fool · GuruFocus.com · Insider Monkey


This analysis is provided for educational and informational purposes only. It is not investment advice. Consult a qualified financial advisor before acting on any information presented here.

📊 Data Sources
yfinance · FRED (St. Louis Fed) · SEC EDGAR · Finnhub · World Bank · Wikidata
Last Updated: 2026-04-28 22:53 KST
This analysis uses public data sources. Investment decisions are your own responsibility.
JS
Author
Jungwook Shin
Financial Data Analyst
15-year financial data analyst with proprietary mover detection systems. Real-time catalyst analysis across US, Korea, and Japan markets.

프로필 보기 →

Leave a Comment

Your email address will not be published. Required fields are marked *

Scroll to Top
𝕏 ƒ in 🔗