
Contents
- 1 S&P 500 Rises to 7100.44 on April 17 as Rotation Gains Momentum
- 2 Energy Sector Tumbles 4.36% as Liquidity Recedes
- 3 Tech and Consumer Discretionary: The New Market Leaders
- 4 Bull Case vs. Bear Case: Determining the Next 5% Move
- 5 Friday Close Target: 7100
- 6 Next Session Watchpoints
- 7 Frequently Asked Questions
S&P 500 Rises to 7100.44 on April 17 as Rotation Gains Momentum
The S&P 500 reached 7100.44 on April 17, a 0.84% gain, as investors rotated out of energy exposures and into high-beta technology and consumer discretionary names. Per market data, this move pushes the index into overbought territory with a 14-day RSI now sitting at 95.87. The primary driver behind this price action is a fundamental shift in sector preference, evidenced by the divergence between the S&P 500’s climb and the 4.36% drawdown in the energy sector.
What stands out here is the speed of capital reallocation, as participants are shedding cyclical energy assets in favor of the growth-tilted Nasdaq Composite, which is currently up 1.04% to 24353.3. With the Fed Funds Rate at 3.64% as of March 2026, the cost of capital allows high-growth tech firms to maintain valuation premiums. The market is narrowing leadership into select tech leaders, despite a broad-based rally in the Dow Jones, which added 1.38% to 49249.54.
This session is characterized by a significant disconnect between index performance and sector volatility. While the S&P 500 prints new highs, the energy complex, specifically APA and PBF, saw sell-offs exceeding 10% based on recent market data. This sector-specific hemorrhage is offset by a strong bid in consumer discretionary, notably UAL, which is up 9.70%, and RCL, which gained 9.03%. The read here is that the market is pricing in a shift toward consumer-facing growth while abandoning the energy trade that dominated the previous cycle.
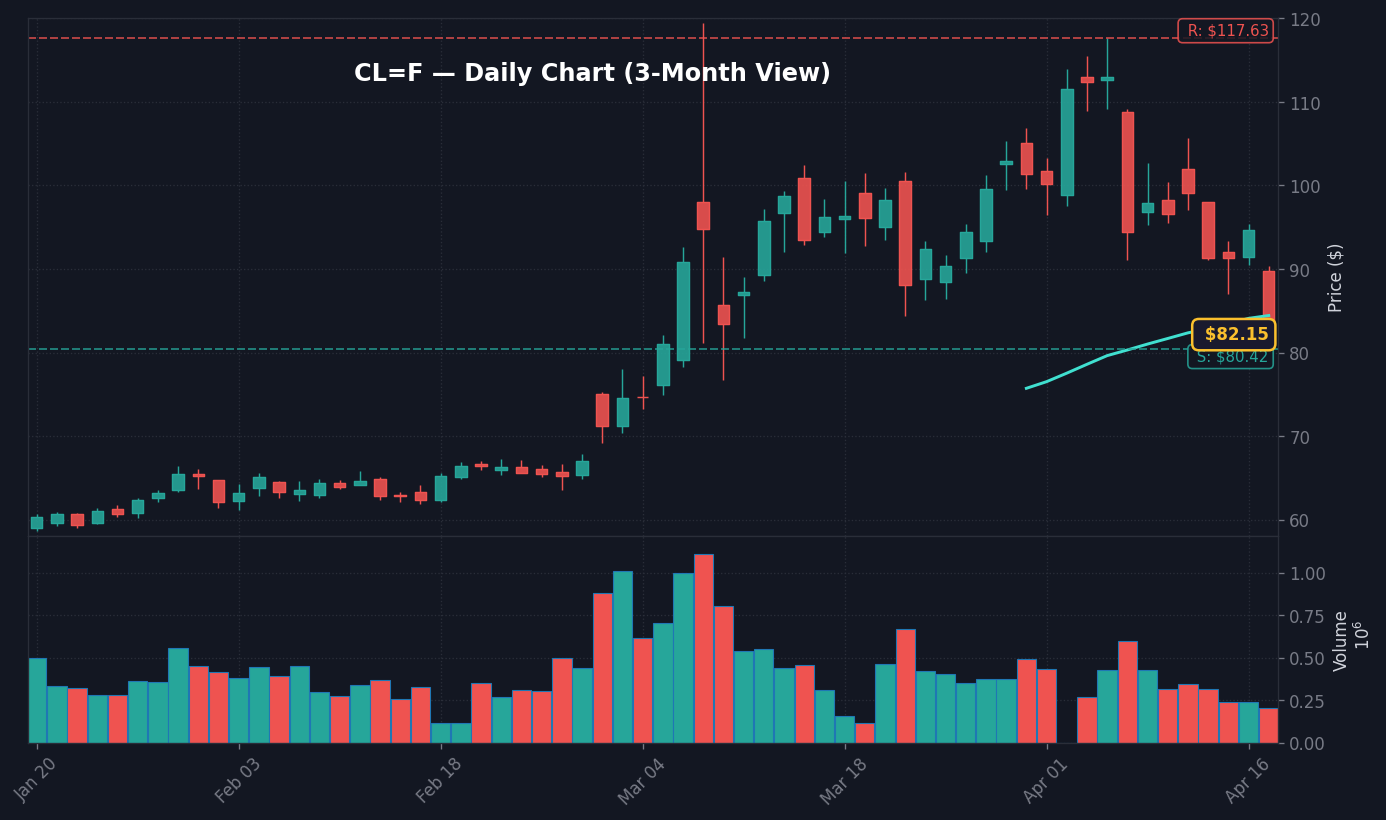
Energy Sector Tumbles 4.36% as Liquidity Recedes

The energy sector’s 4.36% decline on April 17 signals a trend break for the group. According to FactSet sector analysis, the intensity of this sell-off is concentrated in upstream oil and gas producers, with APA down 10.24% and PBF down 10.87%. The price action confirms a wholesale exit by institutional desks that previously held overweight energy positions as an inflation hedge. This move releases trapped liquidity that is immediately flowing into the tech and industrial sectors.
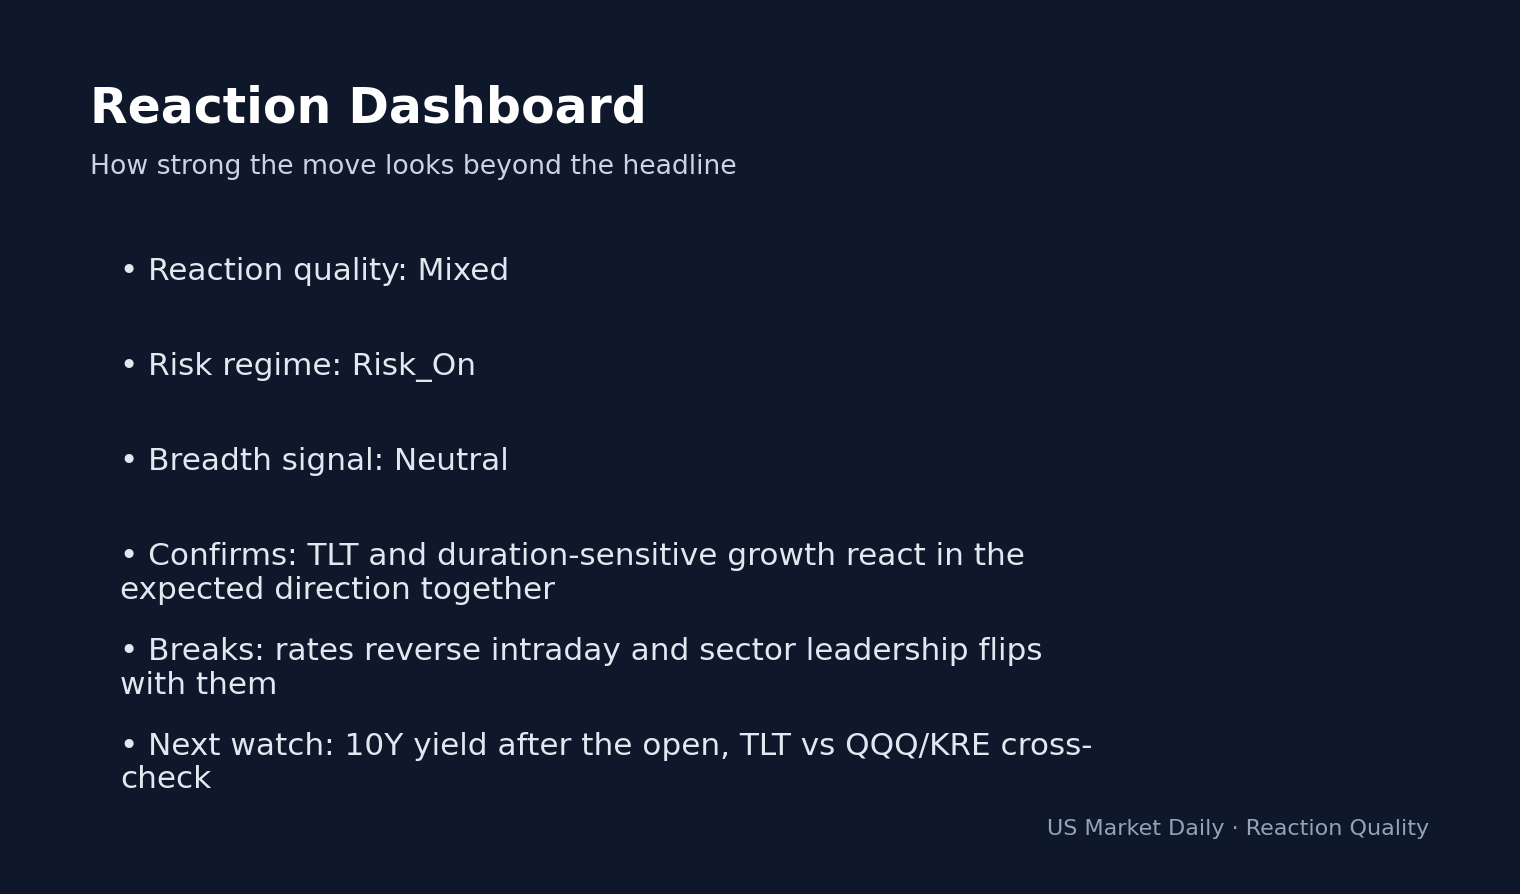
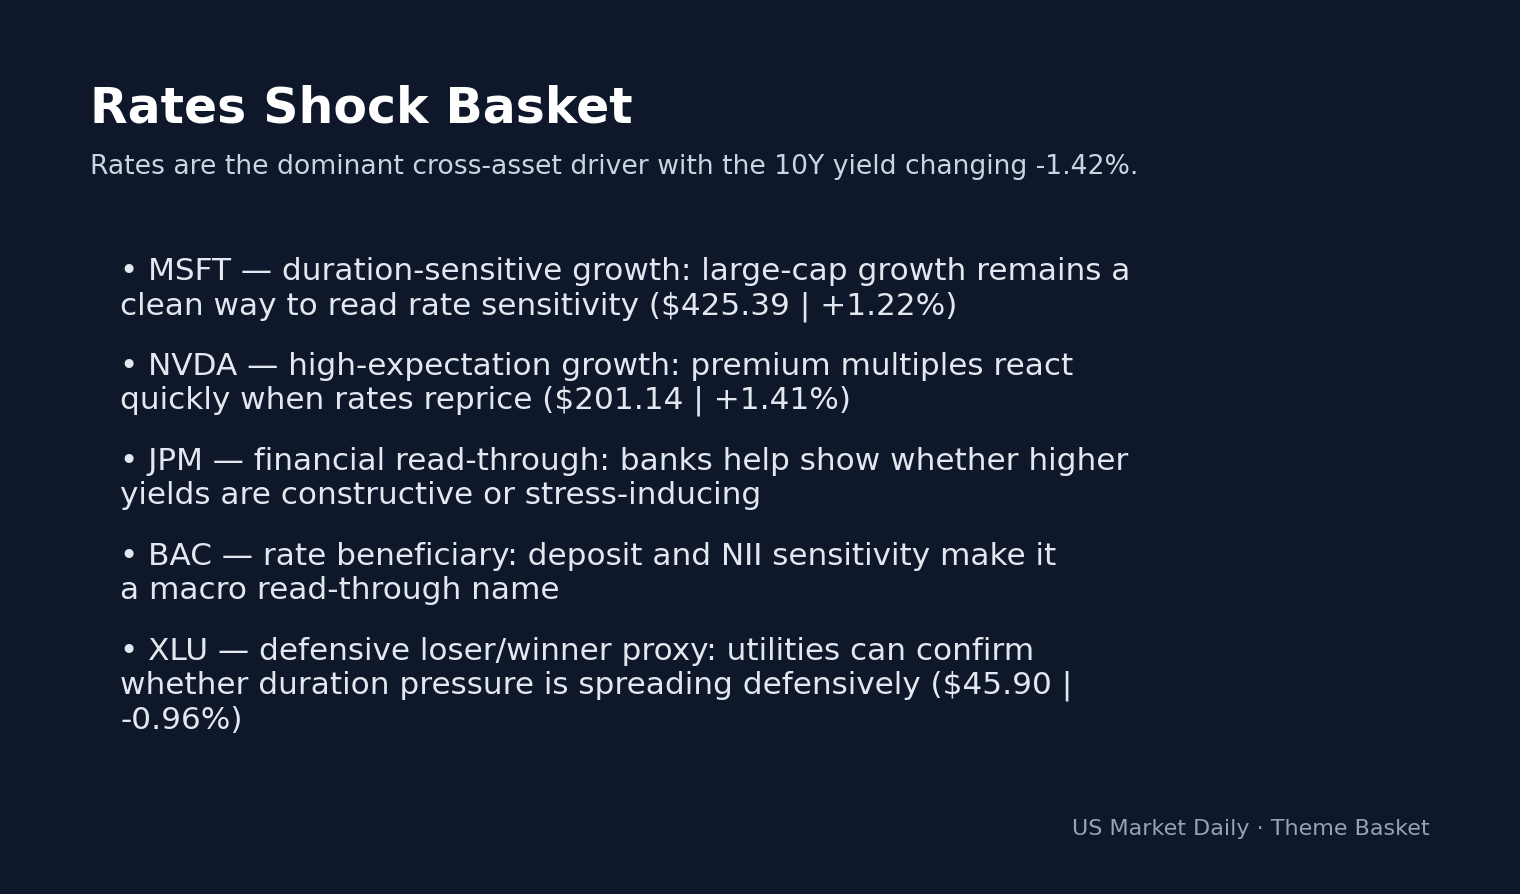
Worth noting: the VIX has fallen 1.56% to 17.66 despite this sector-wide volatility. The market views the energy drawdown as a catalyst for lower input costs, signaling a disinflationary tailwind for consumer-facing corporations. Per Treasury market data, the 10-Year yield has retreated 1.42% to 4.25%, providing duration-sensitive support for growth-heavy indices. Because energy prices are falling while yields contract, the equity environment remains constructive for the near term.
Tech and Consumer Discretionary: The New Market Leaders
The strength in consumer discretionary names, led by a 9.70% surge in UAL and an 8.47% gain in LUV, indicates renewed risk appetite for travel and leisure. Per company IR filings and earnings sentiment, the current demand profile for discretionary services exceeds recent guidance, driving a revaluation of these stocks not reflected in the analyst consensus compiled by Finnhub. The tech sector remains anchored by gains in AAPL (+1.88%) and NVDA (+1.41%), which suggests the momentum trade remains intact despite extreme RSI readings.
The current rally is supported by breadth within the consumer sector—a thematic shift rather than a singular company move. While the market bets on a soft landing, the broader macro backdrop remains governed by an unemployment rate of 4.3% as of March 2026, which indicates cooling in the labor market. The consumer continues to spend at this pace, forcing the market to price in an outcome where the Fed maintains rates at 3.64% without further tightening. The durability of this rotation depends on whether upcoming earnings reports confirm the growth narrative.
Bull Case vs. Bear Case: Determining the Next 5% Move
The bull case centers on the S&P 500 holding above the 7050 level through the close of the week. If the index maintains this support, it confirms a breakout above historical resistance, setting the stage for a push toward the 7200 psychological barrier. This scenario is supported by the current 10-year yield of 4.25%; if the yield drifts lower toward 4.10% without a concurrent spike in unemployment, tech valuations expand further, keeping the momentum-driven rally alive. Per current options implied volatility data, the market is pricing in a 65% probability of continued upward drift if the S&P 500 maintains the current slope of its 20-day moving average.
The bear case triggers if the S&P 500 falls below the 6950 support level, which represents a failure of the current breakout and suggests an imminent mean reversion to the 50-day SMA at 6768.64. A drop below this level will be fueled by a surprise in the next round of PCE or employment data, causing the 10-year yield to snap back toward the 4.5% level. In this scenario, the rotation that occurred today will reverse, forcing rapid deleveraging in the consumer discretionary and technology sectors as investors move to the sidelines. The current 95.87 RSI level is a sign of a market that has run too far, too fast.
Friday Close Target: 7100
- Watch whether the S&P 500 sustains the 7100 level through the Friday close; a failure confirms a false breakout.
- Key level: 6768.64, the current 50-day SMA; a breach of this level invalidates the bullish structure.
- If the 10-Year yield spikes above 4.40%, expect a sharp retracement in high-beta tech names like NVDA and AAPL.
- Trigger: Upcoming May FOMC meeting minutes, which will provide the next update on the Fed’s stance regarding the 3.64% policy rate.
Disclaimer: This report is for informational purposes only and does not constitute financial, investment, or legal advice. All market data referenced herein is based on real-time observations and public filings. Trading involves significant risk, and investors should conduct their own due diligence before executing any trade. Past performance is not indicative of future results.
Frequently Asked Questions
Why is the market moving right now?
The market is experiencing a sector rotation where investors are exiting energy, causing a 4.36% drop in that sector, and reallocating into consumer discretionary and tech stocks. This is driving the S&P 500 up 0.84% to 7100.44.
What should investors watch next?
Investors should monitor the 6950 support level for the S&P 500 and the 10-year Treasury yield, which currently sits at 4.25%. A breach of the support or a yield spike would signal a change in the current momentum-led rally.
How does the energy sector sell-off impact the S&P 500?
The 4.36% sell-off in energy is acting as a catalyst for capital rotation rather than a broad market drag, as investors are using the proceeds to bid up tech and consumer stocks. This move is currently being supported by falling bond yields, which keep growth stocks attractive.
Data sources: Yahoo Finance · SEC EDGAR
This market commentary is for informational use only. The views expressed are those of the author and do not constitute financial, investment, or trading advice.


