
S&P 500 Gains 0.17% to 7034.73 on April 16, 2026: Market Alert
The S&P 500 reached 7034.73 at 09:34 AM ET on April 16, 2026, marking a 0.17% gain as liquidity conditions remain tight. The index currently trades well above its 50-day moving average of 6764.16, according to real-time market data. The RSI of 83.19 indicates the index has reached extreme overbought territory.
What stands out here is the persistent divergence between index performance and breadth. Energy leads the charge today, posting a 1.12% increase per FactSet, as the market recalibrates exposure. The 10-Year Treasury yield fell to 4.27% today, down from the 4.70% peak reached in March, providing a supportive backdrop for equity valuations as capital flows shift from bonds into risk assets.
Investors must navigate the current liquidity regime. With the VIX at 18.25 and rising 0.44% today, hedging activity is accelerating. Professional traders are pricing in tail risk. The disconnect—the simultaneous rise in both the index and the VIX—is a hallmark of late-cycle expansion where portfolios are hedged against shocks.
Energy and Tech Divergence: Why 1.12% Matters
The 1.12% surge in the Energy sector acts as the primary catalyst for today’s session. Per official market data, this rotation pulls liquidity away from the Technology sector, which is up a modest 0.31%. This movement confirms market participants are rotating into value-oriented segments to preserve capital. The market is attempting to broaden its base, signaling a move away from momentum-only leadership toward a cyclically-aligned structure.
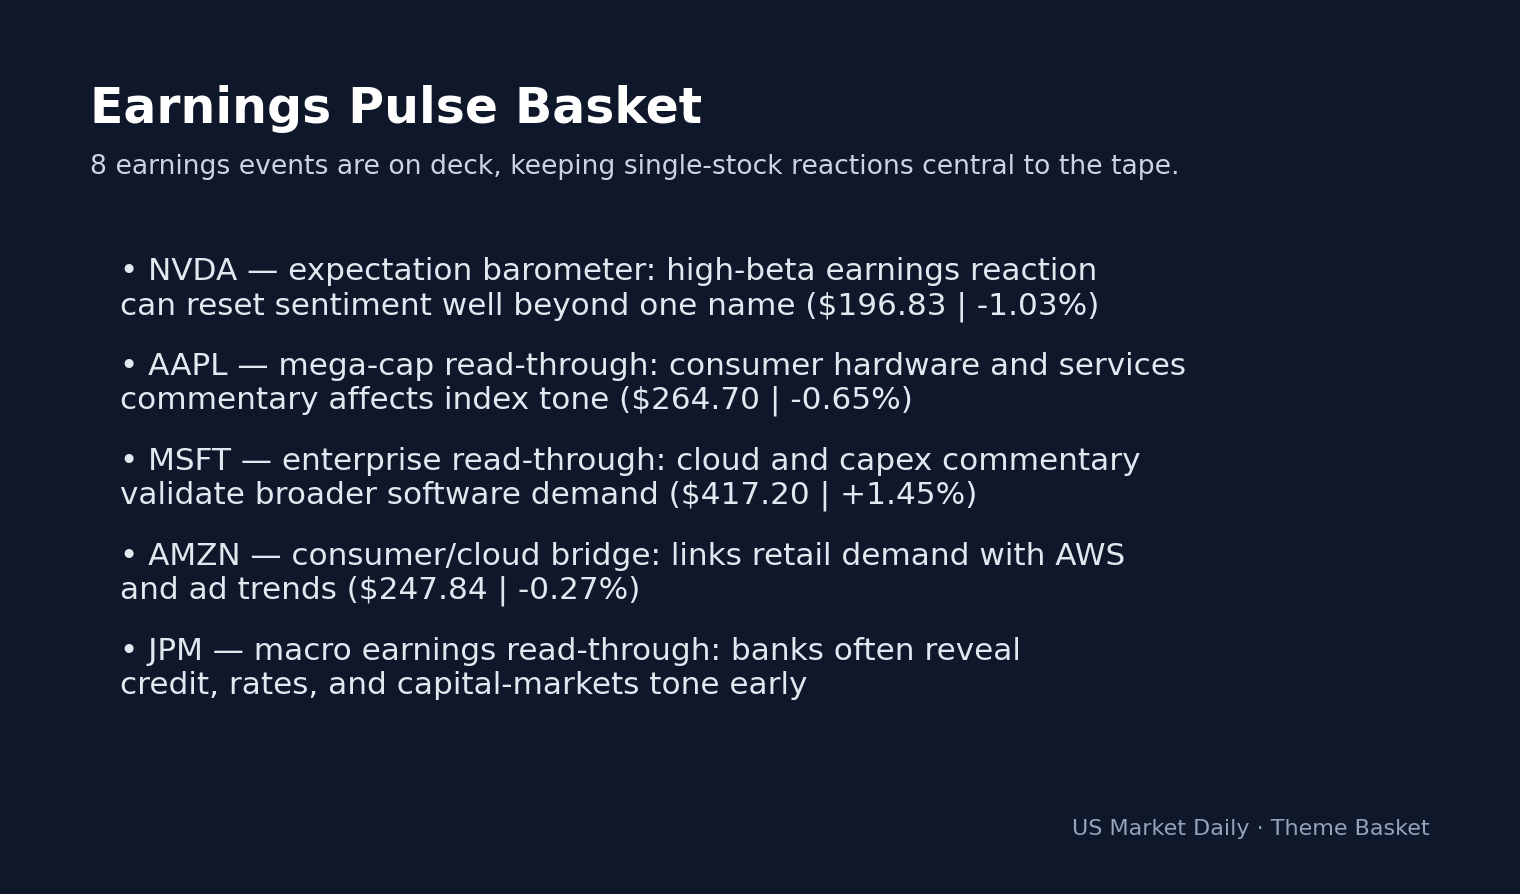
Tech giants like NVIDIA are feeling the pressure, with NVDA trading at 196.97, down 0.95% today, according to market data. This shows that even in an environment of broad gains, the concentrated AI trade is susceptible to profit-taking. Investors are becoming more discerning, locking in gains in high-multiple names to fund moves into laggard industries. This dynamic helps stabilize the S&P 500 as the index weight becomes less dependent on a single set of earnings drivers.
BULL CASE vs BEAR CASE: Navigating the 7000 Level
In the bull case, the S&P 500 maintains momentum above the 7000 psychological support level, fueled by the decline in the 10-Year Treasury yield to 4.27%. If the index holds 7000, it validates the bullish trend, driving further inflows toward the 7100 resistance level. Bullish catalysts remain anchored in the 4.3% unemployment rate, which ensures consumer spending provides a floor for earnings growth, per recent FRED macro data.
Conversely, the bear case triggers if the S&P 500 breaks decisively below the 6950 support level. A breach here initiates a mean-reversion phase toward the 50-day SMA of 6764.16, as traders react to the RSI of 83.19. If the VIX continues its upward trend above 20, forced deleveraging of long positions will accelerate the downside, leading to a sharp, high-volume contraction in the tech-heavy Nasdaq.
Fed Watch: Rate Trajectory at 3.64%
- Watch whether the S&P 500 sustains its breakout above 7030 to confirm volume support; invalidation occurs if the index closes below 6950.
- Key pivot: 6950 support serves as the threshold for institutional conviction.
- Yield trigger: If the 10-Year Treasury yield climbs back above 4.35%, high-multiple growth stocks like NVDA will face immediate selling pressure.
- Policy signal: Monitor the Fed Funds Rate expectations to confirm the interest rate trajectory following the 3.64% baseline established in March.
Disclaimer: This market brief is provided for informational purposes only and does not constitute financial, investment, or trading advice. All market data is sourced from real-time reporting services. Readers should perform their own due diligence before making any financial decisions.
Frequently Asked Questions
Why is the market moving right now?
The market is moving due to a tactical rotation from high-multiple tech stocks into cyclicals like Energy, which rose 1.12%. Simultaneously, the 10-Year Treasury yield’s decline to 4.27% is providing a supportive backdrop for broader equity valuations.
What should investors watch next?
Investors should watch the 7000 support level on the S&P 500 to confirm trend sustainability. Additionally, tracking the 10-Year Treasury yield is critical, as a move back above 4.35% would likely trigger a rotation out of growth-oriented technology stocks.
How does the RSI reading affect the current outlook?
The current RSI of 83.19 indicates the S&P 500 is in extreme overbought territory. This suggests that while momentum is strong, the index is vulnerable to a technical mean-reversion if positive catalysts fail to materialize.
Data sources: Yahoo Finance · SEC EDGAR
The information presented here is for general informational purposes only and should not be considered as personalized investment advice. All investing involves risk.


