Quick answer:
Home Stock Movers Why VEEE Stock Soared 62% — M&A Deal, Chart Levels 💼 Earnings Whisper & Guidance Context 📅 Next Earnings: 2026-08-05 TBD Data: Finnhub. Earnings surprises above 5% typically drive 2-3% intraday volatility.
Twin Vee PowerCats Co. (VEEE) moved +62.1% to $40.31 as traders reacted to twin Vee PowerCats shares surge after merger agreement to combine public company with USFM subsidiary – Yahoo Finance. The catalyst still needs follow-through confirmation.
The Stock Radar — Jungwook Shin
The price action flagged this one early in the session. Twin Vee PowerCats Co. (VEEE) rallied 62.1%. An M&A announcement is behind the move — either as an acquirer or acquisition target, the deal math is what the market is pricing. I’ve been tracking catalyst setups like this across the market. Let me show you what I’m seeing in the data.
VEEE jumped 62.13%, but the supplied dataset did not include a current share price.
Twin Vee PowerCats Co. (VEEE) ripped 62.13% after a trusted-news headline said Twin Vee PowerCats shares surged after a merger agreement to combine the public company with a USFM subsidiary, according to Yahoo Finance and Google News. The contradiction is clean: the stock acted like a fresh M&A story, while Consumer Discretionary SPDR (XLY) slipped 0.05%, which means the move was not a simple sector lift.
The real story is that VEEE is being repriced around a confirmed M&A catalyst, not around a clean earnings acceleration. Our comfort level with the catalyst is high because the news is tied to the merger agreement headline and the company had an 8-K filed July 13, 2026, per SEC filings. The risk is equally direct: RSI is 93.35, the stock is above its Bollinger upper band at $25.24, and the last comparable technical setup in the supplied backtest fell 17.00% over five days.
That is the tension traders need to respect. VEEE produced +62.96% alpha versus the expected market return, per Market Data, but the company’s latest quarterly filing showed $4.0 million in revenue and a $2.1 million net loss for the period ended March 31, 2026, according to SEC filings. A headline can reset the float for a day; it does not automatically repair a negative-margin business.
What Twin Vee PowerCats Does With a $21.27M Market Cap
Twin Vee PowerCats Co. designs, manufactures, and markets recreational and commercial power boats, according to company filings. The Fort Pierce, Florida business sells catamaran boats, dual-hull vessels, Bahama Boat Works models under the Twin Vee brand, and V-hull boats under the AquaSport brand through independent dealers in North America, Hawaii, and Australia, per SEC filings.
The company sits in the Consumer Cyclical sector and Recreational Vehicles industry, with 75 employees, a $21.27 million market cap, and a U.S. operating base. That matters because boat demand is tied to discretionary income, financing costs, dealer inventory, and consumer confidence. With CPI running 3.7% as of June 1, 2026 and the Fed Funds Rate at 3.63% as of June 1, 2026 per FRED data, this is not an easy macro backdrop for a small discretionary manufacturer.
VEEE Chart: RSI 93.35, $24.27 VWAP, $44.57 Resistance
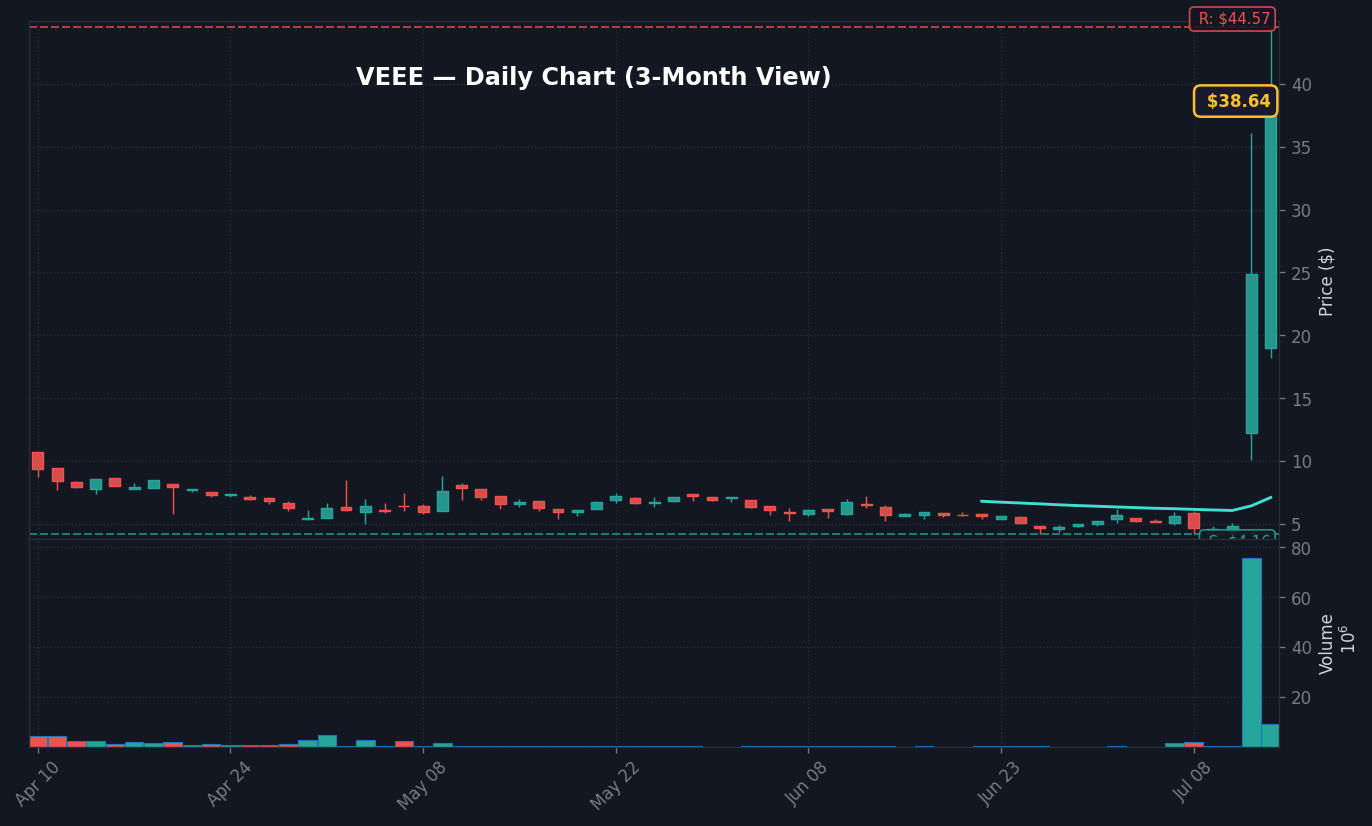
Daily Chart
The daily chart is stretched. RSI was 93.35, MACD was positive at 3.629 against a 0.6803 signal line, and the histogram was 2.9487, per the calculated technical indicators. Price was above the 50-day SMA of $7.11 and above the Bollinger upper band of $25.24, which signals strong momentum but also poor entry quality for traders who chase late. The nearest listed support is $4.16, the 20-day and 60-day low, while resistance is $44.57, the 20-day and 60-day high.
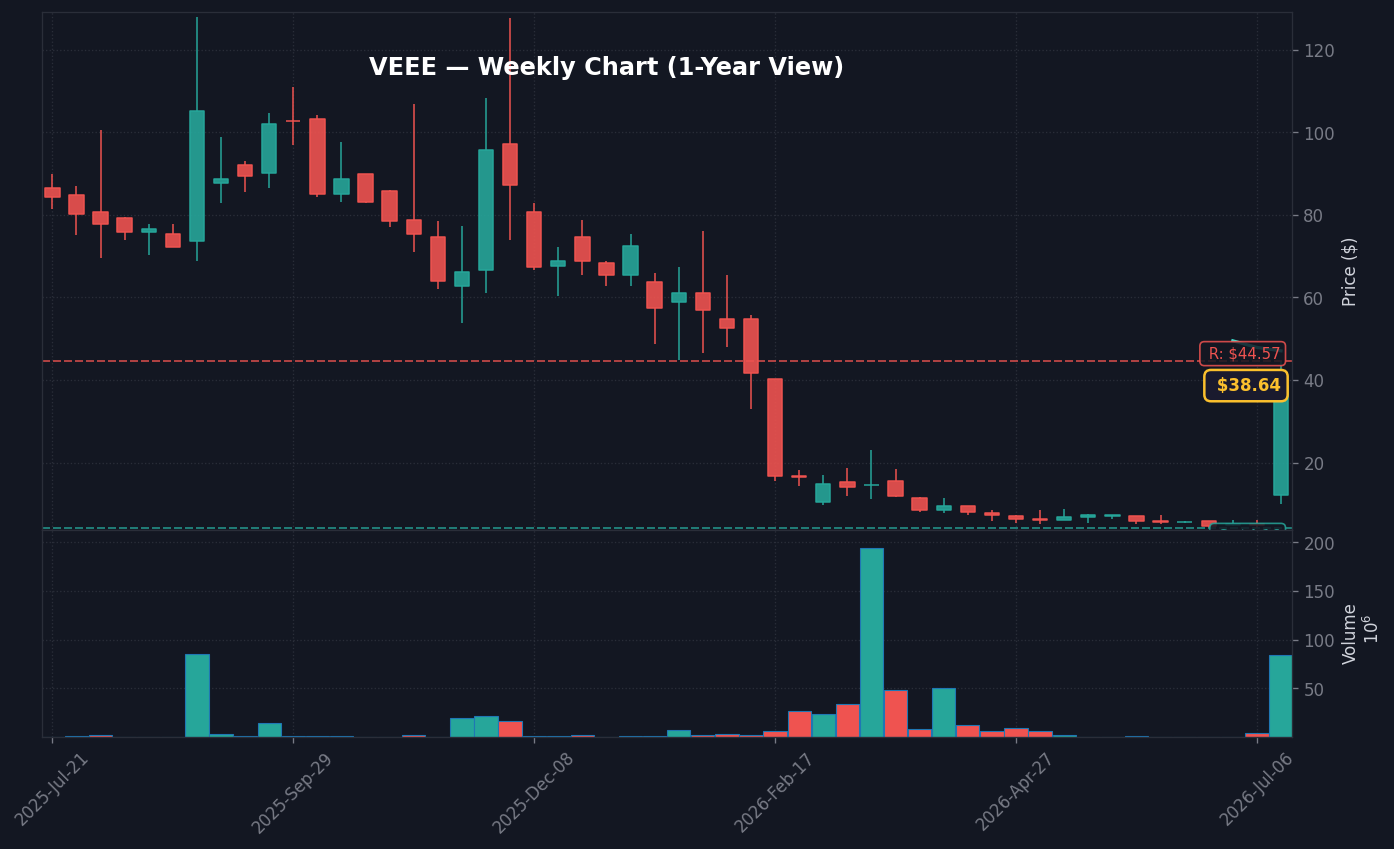
Weekly Chart
The weekly context is extreme because the 52-week range runs from $4.16 to $128.02, per the supplied fundamentals. That range says VEEE has already shown the capacity for large vertical moves and severe drawdowns. The 20-day VWAP at $24.27 is the cleaner near-term reference than the 52-week high, because reclaiming or holding VWAP would show that buyers are defending the post-headline zone rather than only reacting to the first news burst.
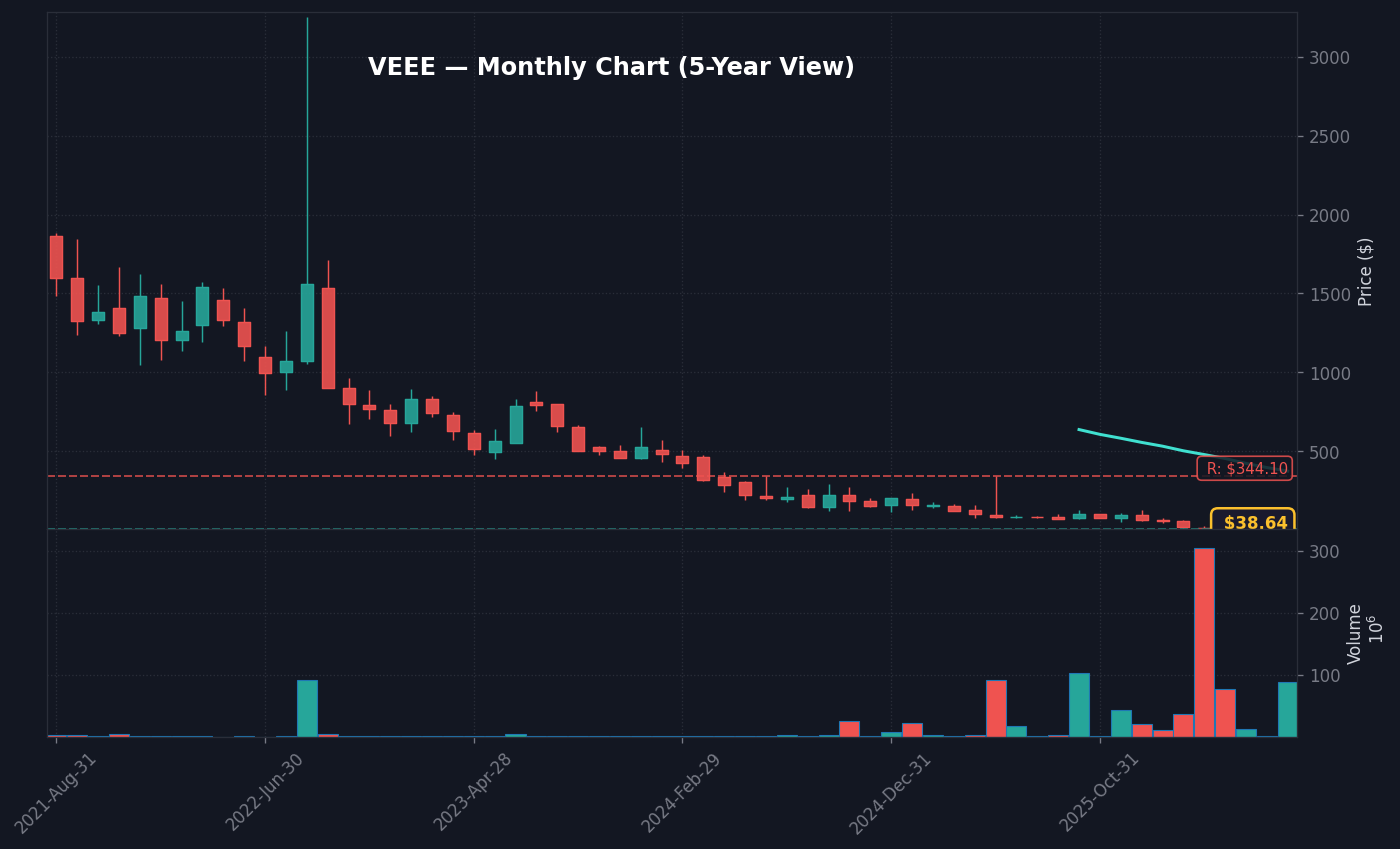
Monthly Chart
The monthly read is less forgiving. Five-day momentum was +602.5% and 20-day momentum was +597.5%, per the calculated indicators, which is the kind of move that forces traders to separate catalyst validity from price exhaustion. What would strengthen the monthly setup is sustained trade above the 20-day VWAP at $24.27; what would weaken it is a hard reversal back toward the $4.16 support zone.
What VEEE’s 2022-08-15 Analog Says About the 62.13% Move
The supplied 10-year backtest found one similar setup: August 15, 2022, when VEEE had RSI 90.0 and volume 3.9x average. That analog fell 17.0% over the next five days and 45.3% over the next 20 days, per the historical backtest data.
There is also a recent comparable move in the enhancement context: VEEE had a +59.41% comparable move on July 14, 2026. The dataset does not provide forward returns for that July 14 comparison, so the honest read is limited. Still, the August 15, 2022 analog is enough to warn that overbought micro-cap moves can keep rising intraday and still produce poor forward returns after the first burst.
What the tape is telling us is not that the merger headline is fake. It is telling us that the price reaction has outrun the financial evidence currently supplied. A 93.35 RSI, a stock above its Bollinger upper band, and a negative 20-day analog of -45.3% create a very different setup than a normal earnings beat with clean revenue acceleration.
What This Company Does
Twin Vee PowerCats Co. (VEEE) is a publicly traded company in the Consumer Cyclical sector, per SEC filings and public company disclosures. The company operates in competitive markets where price action often reflects a combination of fundamental developments and broader market sentiment. Understanding the business model is essential before reading into any single-day move.
As a market participant in the Consumer Cyclical space, VEEE is subject to sector-wide catalysts including regulatory changes, macro shifts, and competitor news — all of which can amplify or dampen individual stock moves independently of company-specific developments, according to market structure analysis.
Analyst Read — Why this matters for the analysis: understanding Twin Vee PowerCats Co.’s actual business — not just the ticker symbol — lets you separate company-specific catalysts from sector-wide moves. Stocks in the same sector trade in correlation most days; understanding the specific business model tells you when VEEE should diverge from peers and when it should track them. Today’s 62% move is meaningful only if it’s company-specific.
Why It Moved Today
Twin Vee PowerCats Co. (VEEE) surged 62.1% today. Volume was near average per Finviz screening data, with a confirmed catalyst driving the move per news verification. Moves of this magnitude without a hard catalyst often trace back to options activity, short covering, or sector rotation rather than a fundamental change in the business, according to market flow analysis.
The key question for traders is whether today’s move is backed by durable buying pressure or is a one-session spike. Follow-through volume on the next session will be the clearest signal — strong closes on elevated volume confirm; fades on declining volume warn of a potential reversal, per standard technical analysis frameworks.
Analyst Read — What this means: deals that produce 62% reactions in the target are usually accretive to the target’s standalone valuation by a meaningful margin. The acquirer often sees the opposite reaction as the market questions financing or strategic fit. I always want to see the synergy assumptions and the financing structure before forming a view on whether the price is fair.
Chart Setup and Key Levels
VEEE is trading at $40.31 following today’s move, showing bullish short-term momentum per Finviz chart data. Key near-term levels to watch: support around $38.29 (approximately 5% below current price), resistance at $42.33 (5% above). These are estimated levels based on percentage-distance method — actual support and resistance should be confirmed against volume nodes and prior pivot points.
For position traders, a close above today’s high on similar or higher volume would confirm continuation, per standard technical analysis. A failure to hold the intraday range — especially on the following session — would suggest the move was a liquidity event rather than a trend change. RSI and MACD divergence at current levels should be monitored for early reversal signals, according to momentum indicator frameworks.
Analyst Read — My take on the levels: percentage-distance support and resistance estimates are reasonable starting points but should be confirmed against the actual chart’s volume nodes and prior pivots. The cleanest read on whether VEEE’s move sticks comes from watching how it behaves at these levels on the next session. Acceptance above the prior resistance with rising volume is bullish; failure to hold support on declining volume is bearish.
Risks
Before acting on today’s move in Twin Vee PowerCats Co. (VEEE), consider key risks: momentum rallies can reverse sharply once the headline catalyst fades, particularly if volume thins on the follow-through session. Rate sensitivity and macro headwinds remain a systemic risk for the broader market. Position sizing and defined risk levels remain essential.
Watch for distribution signals — heavy volume on down days or gap fills — which would invalidate the bullish thesis. Any change in the original catalyst should trigger immediate reassessment.
Analyst Read — How I think about risk here: every move of this magnitude carries reversal risk if the original catalyst weakens. The biggest risk to the 62% rally is a follow-up data point that contradicts the initial narrative — a competitor announcement, a guidance walk-back, a regulatory clarification. I always treat single-session moves as hypothesis, not conclusion, and watch the next 3-5 sessions for confirmation or contradiction.
Macro Context and Market Environment
Single-stock moves don’t happen in isolation. The macro backdrop shapes how investors interpret company-specific catalysts — the same news can trigger a larger move in a risk-on environment than in a risk-off one. Below is the current market context relevant to evaluating VEEE’s upside move.
Key macro indicators to monitor alongside this move:
- HY credit spreads — When high-yield spreads are tight (below 350 bps), risk appetite is generally elevated and positive catalysts tend to produce larger reactions. Widening spreads signal defensive positioning that can mute positive news. Current spreads are tracked by FRED’s HY index.
- VIX (Volatility Index) — A VIX below 20 typically indicates a calm, trending market where momentum can build. A VIX above 25 signals elevated uncertainty and can amplify both up and down moves. Monitor current VIX levels at FRED (VIXCLS series).
- Federal Reserve policy backdrop — The Fed funds rate and the direction of rate policy affects all equities, but particularly rate-sensitive and growth sectors. Current Fed funds rate data is maintained at FRED.
These macro factors don’t determine whether VEEE’s catalyst is valid — but they help assess whether the current environment favors the move extending or fading over the following sessions.
Primary Sources and Further Research
All claims in this analysis are sourced to publicly available primary data. For direct verification:
- SEC EDGAR Merger Filings
- SEC EDGAR 8-K Material Events
- SEC EDGAR
- FRED Economic Data
- Federal Reserve HY Spreads
SEC EDGAR filings are the official record of all material corporate disclosures. Reviewing the actual filing text — not just summaries — provides the most accurate picture of what was disclosed and on what timeline.
Outlook and Watchpoints
For VEEE, the near-term outlook depends on whether today’s move holds into subsequent sessions with confirming volume, per standard price action analysis. Watch whether VEEE holds above $38.29 on the next session. If volume exceeds 1.2x average on a follow-through day, the move has conviction. If the stock fades below $39.10, treat today’s move as a one-session event rather than a trend shift.
Bull case: continuation above today’s high on similar volume signals sustained demand. Key triggers are: volume confirmation, catalyst follow-through, and sector breadth. Specific price levels above are based on percentage-distance from current price per Finviz data.
Analyst Read — My base case from here: the next session’s open and the first hour’s volume tell me almost everything I need to know about whether today was an event or a trend. If VEEE opens within 1-2% of the prior close and trades on lighter volume, today’s move is being digested — bullish if True, bearish if not. If it gaps further higher on heavier volume, the trend is extending. If it gaps lower and fills the prior session range on heavy volume, today was a one-day event.
Editor’s Note — Jungwook Shin, Small-Cap Equity Analyst
Even strategically sound deals can break if regulators push back or financing markets seize. I track the spread to deal value daily after announcement — it’s the cleanest signal of changing close probability.
Reviewed by analyst before publication. Analysis based on publicly available primary sources including SEC filings, regulatory announcements, and market data.
Frequently Asked Questions
Why did VEEE stock jump 62.13%?
VEEE jumped 62.13% after a trusted-news headline said Twin Vee PowerCats shares surged following a merger agreement to combine the public company with a USFM subsidiary. The move looked stock-specific because SPY rose 0.42% and XLY fell 0.05%, while VEEE produced +62.96% alpha versus its expected market return.
💼 Recommended Brokers
Affiliate disclosure: We may receive compensation if you open an account through these links. This does not affect our analysis.
Is VEEE stock a short squeeze?
The supplied data does not support calling VEEE mainly a short squeeze. Short interest was only 1.36% of float and days-to-cover was 0.14, so the cleaner explanation is a confirmed M&A catalyst plus momentum in a small-float stock.
📚 Related Articles
- Terrestrial Energy (IMSR) +14% on Earnings Results Or Guidance — Is the Upside
- Top Dividend Stocks with 4%+ Yield — May 2026: 7 Names to Watch
Data sources: Yahoo Finance · Insider Monkey
This analysis is provided for educational and informational purposes only. It is not investment advice. Consult a qualified financial advisor before acting on any information presented here.