
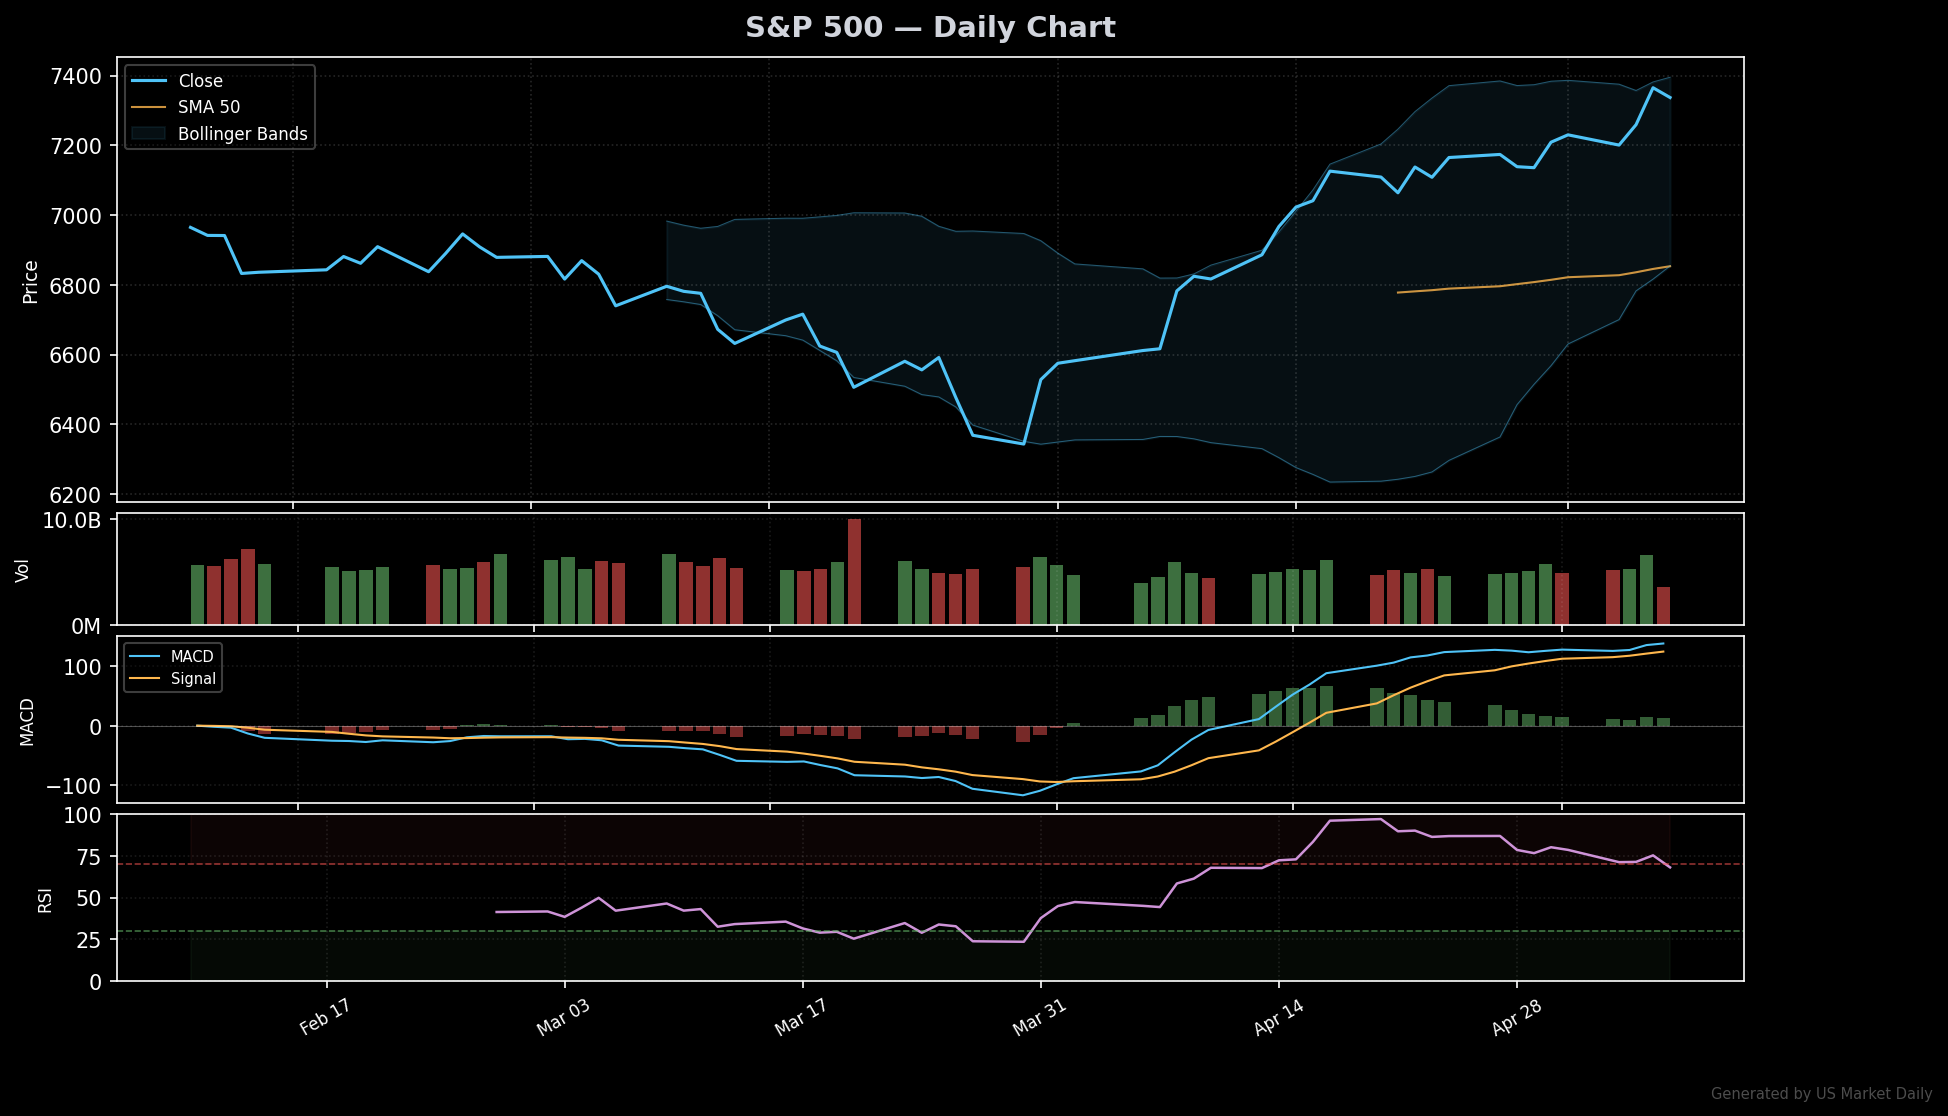
S&P -0.4%, Nasdaq -0.0%: Selloff Context
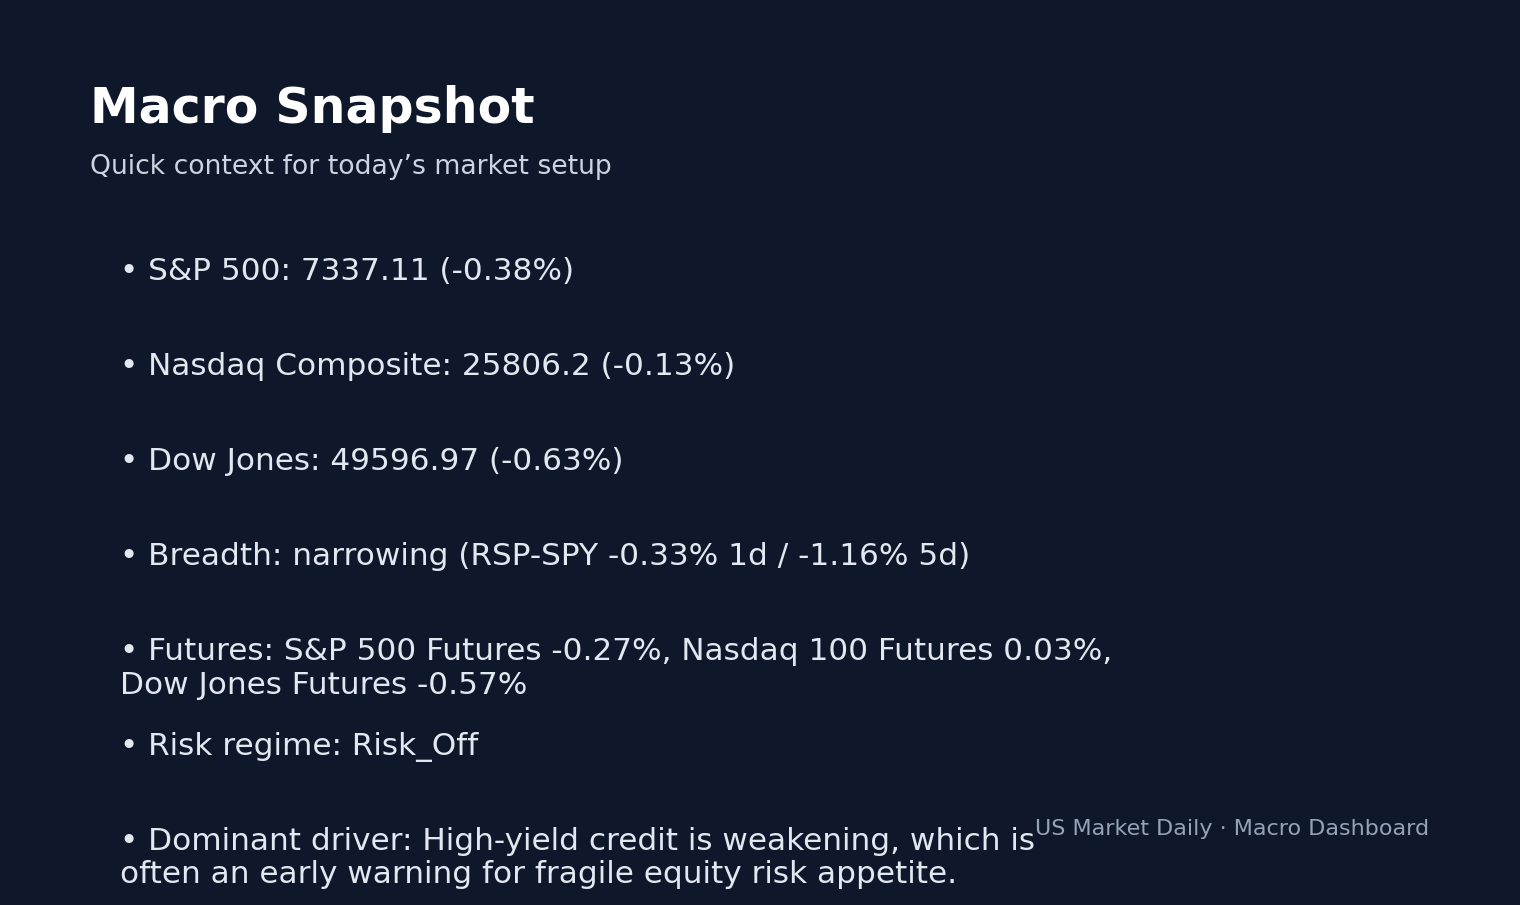
The broader market experienced a volatile session on May 7, 2026, characterized by a sharp rotation out of growth and discretionary names as the S&P 500 Index retreated, reflecting heightened sensitivity to macroeconomic shifts. The 10Y Treasury yield climbed to 4.39%, per Treasury data as of May 7, 2026, creating a restrictive environment for equities that rely heavily on future cash flow discounting. What stands out here is the divergence in market breadth; the RSP-SPY spread narrowed by -0.33%, per S&P data, indicating that the selling pressure was heavily concentrated in specific high-beta segments rather than an indiscriminate exit. Volume across the board surged, with several laggards trading at 3x to 10x their 20-day averages, which signals an aggressive institutional reallocation or forced liquidation of leveraged positions. The VIX closed at 17.1, down 1.7% per CBOE data, suggesting that while price action was violent for specific tickers, the broader market remained relatively composed. The real story is that this selloff was driven by company-specific guidance misses compounded by a macro backdrop that no longer tolerates growth-at-any-price narratives. This report is provided for informational purposes and is not investment advice. This signals risk-off sentiment across equities.
Biggest Losers Today
FSLY, PLNT & More: Stock-by-Stock Breakdown
The equity landscape today saw significant wealth destruction in growth and consumer-facing sectors, with the following 10 tickers facing heavy selling pressure.
Fastly, Inc. (FSLY) dropped 38.2% to $19.50, driven by a disastrous outlook that rattled investor confidence, per Yahoo Finance data. Trading at 44% below its 52-week high of $34.82, the stock changed hands on 3.1x average volume. The sharp decline reflects the market’s intolerance for any deceleration in edge computing margins.
Planet Fitness, Inc. (PLNT) plummeted 31.2% to $44.01 in response to a surprise downgrade, per market data. Currently trading 61% below its 52-week high of $114.47 on 9.2x average volume, the stock is pricing in a fundamental shift in consumer gym attendance habits.
Shake Shack, Inc. (SHAK) fell 28.3% to $69.24 as a result of rising input costs impacting quarterly guidance. Per Yahoo Finance, the stock is 52% below its $144.65 peak, with 10.8x average volume, which signals a massive exit by institutional holders.
Installed Building P (IBP) declined 27.6% to $216.92 due to softening housing starts, per SEC filings. It is now 37% below its $349.00 high, trading on 5.1x average volume.
Amprius Technologies (AMPX) saw a 27.4% drawdown to $16.11, driven by sector rotation away from speculative battery plays. Per market data, it is 29% below its $22.80 high on 3.5x volume.
GPGI, Inc. (GPGI) fell 25.9% to $12.94, reflecting investor concern regarding cash burn, with volume hitting 3.8x the norm.
Insmed Incorporated (INSM) cratered 23.4% to $105.00 due to data transparency questions, per Yahoo Finance. Trading 50% below its $212.75 high on 6.1x volume, the disconnect is evident between clinical expectations and current valuation.
Zoetis Inc. (ZTS) slipped 21.5% to $87.31 in response to revised growth targets, per FactSet consensus data. It is currently 49% below its $172.23 peak, trading on 7.0x volume.
Centuri Holdings, In (CTRI) dropped 19.6% to $33.60, driven by general infrastructure sector volatility. Trading on 3.2x volume, it remains 21% off its $42.98 high.
DXP Enterprises, Inc (DXPE) fell 17.3% to $150.02, as a result of industrial supply chain concerns, per SEC EDGAR filings. It is 18% below its $183.91 high on 2.1x volume.
Recovery Potential
Recovery prospects for the hardest-hit names are currently bleak, as technical indicators suggest a breakdown in long-term bullish trends. For FSLY, the $18.50 level serves as a critical support; however, per FactSet consensus, only 4 of 12 analysts currently maintain a Buy rating, which signals deep skepticism regarding a near-term mean reversion. The drop in PLNT is particularly concerning because it violates a long-standing support range, turning the stock into a “wait and see” prospect rather than a value play. In contrast, ZTS exhibits a classic “oversold” profile based on our data methodology; while the bear case suggests further downside to $80.00 as institutional portfolios trim, the bull case rests on its dominant market position in pet therapeutics once volatility subsides. We caution that historical analogs show that stocks falling on 8x+ volume rarely recover their peak levels within a single fiscal quarter, indicating that this is likely a structural repricing rather than a temporary dip.
Outlook & Risk Assessment
The market now faces a period of heightened sensitivity to incoming economic prints, specifically the labor data coming from the BLS on May 8, 2026. Should the yield on the 10Y Treasury push above 4.45%, we expect contagion to spread from the current high-growth laggards into the broader mid-cap index. A secondary catalyst involves the upcoming mid-quarter earnings updates, which could force further guidance cuts in the consumer discretionary sector. Investors should remain disciplined, as catching falling knives in this environment is statistically unfavorable without a stabilization of volume. We define a reversal signal as a session where these tickers trade at or below 0.8x their 20-day average volume while reclaiming at least 5% of today’s losses. Failing that, risk remains skewed to the downside.
Watch: 10Y Treasury yield sustainability above 4.40% as a proxy for equity risk.
Key level: FSLY support at $18.50; failure to hold this zone likely triggers a slide toward $15.00.
Trigger: Any 8-K filing indicating revised downward revenue guidance for Q3 will invalidate the current “hold” thesis for the industrial segment.


