
Market Close Recap
According to Yahoo Finance, A 5.4 percentage point spread between sectors tells the real story of today’s session: while the S&P 500 gained a modest 0.72% to 6,575.32, massive capital flows underneath drove Industrials up 1.67% and crushed Energy down -3.74%. This isn’t about market direction—it’s about money rotating aggressively under a deceptively calm index print.
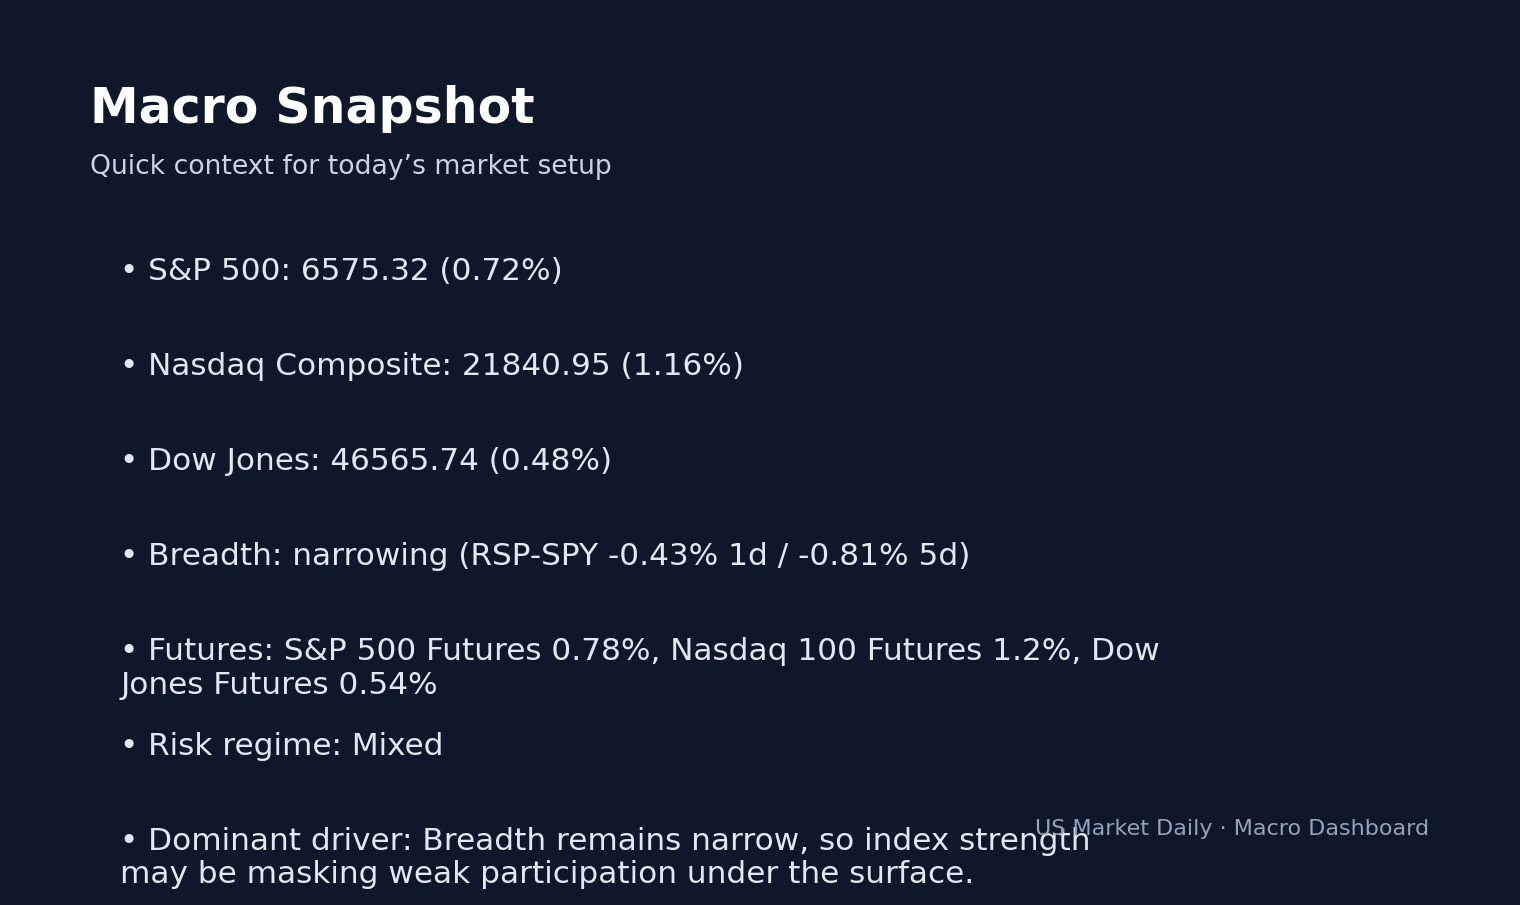
Breadth indicators reveal the surface calm masks internal stress. RSP equal-weight S&P gained just 0.32% versus SPY’s 0.75%, widening the participation gap to -0.43% on the day and -0.81% over five sessions. Index strength continues masking weak participation beneath, a pattern that often precedes either meaningful breadth expansion or index correction.
According to Yahoo Finance, Cross-asset moves validate the rotation story: WTI crude oil plunged -2.13% to $99.22, directly pressuring Energy names. The US Dollar weakened -0.36% while gold spiked 3.21% to $4,796.70. The VIX dropped -2.81% to 24.54, suggesting complacency despite clear sectoral stress patterns.
Tech and Industrials Drive Gains While Energy Implodes
The Nasdaq Composite led major indices with a 1.16% gain to 21,840.95, powered by Technology’s 1.55% sector advance. Intel emerged as the session’s standout winner, surging 8.84% to $48.03 on foundry execution optimism and PC cycle recovery themes. Google parent Alphabet jumped 3.42% to $297.39, while AMD gained 3.33% to $210.21 on continued AI GPU demand.
Industrial strength came from diverse sources. Caterpillar rallied 3.09% to $730.32, reflecting construction equipment demand resilience, while Boeing climbed 4.17% to $207.32. The Dow Jones managed just a 0.48% gain to 46,565.74, held back by weak performance in defensive sectors.
Energy’s -3.74% collapse made it the session’s clear loser, with crude oil’s decline pressuring the entire complex. Consumer Staples also declined -0.63%, suggesting defensive rotation out of traditional safe havens. Ten-year Treasury yields rose 0.19% to 4.32%, creating additional headwinds for rate-sensitive sectors.
Breadth Deterioration Signals Potential Index Fragility
The narrowing breadth pattern raises concerns about rally sustainability. With RSP underperforming SPY by 0.43% today and 0.81% over five days, the market continues relying on fewer names for index performance. This concentration risk commonly resolves through either broad-based participation expansion or index pullback to reset participation levels.
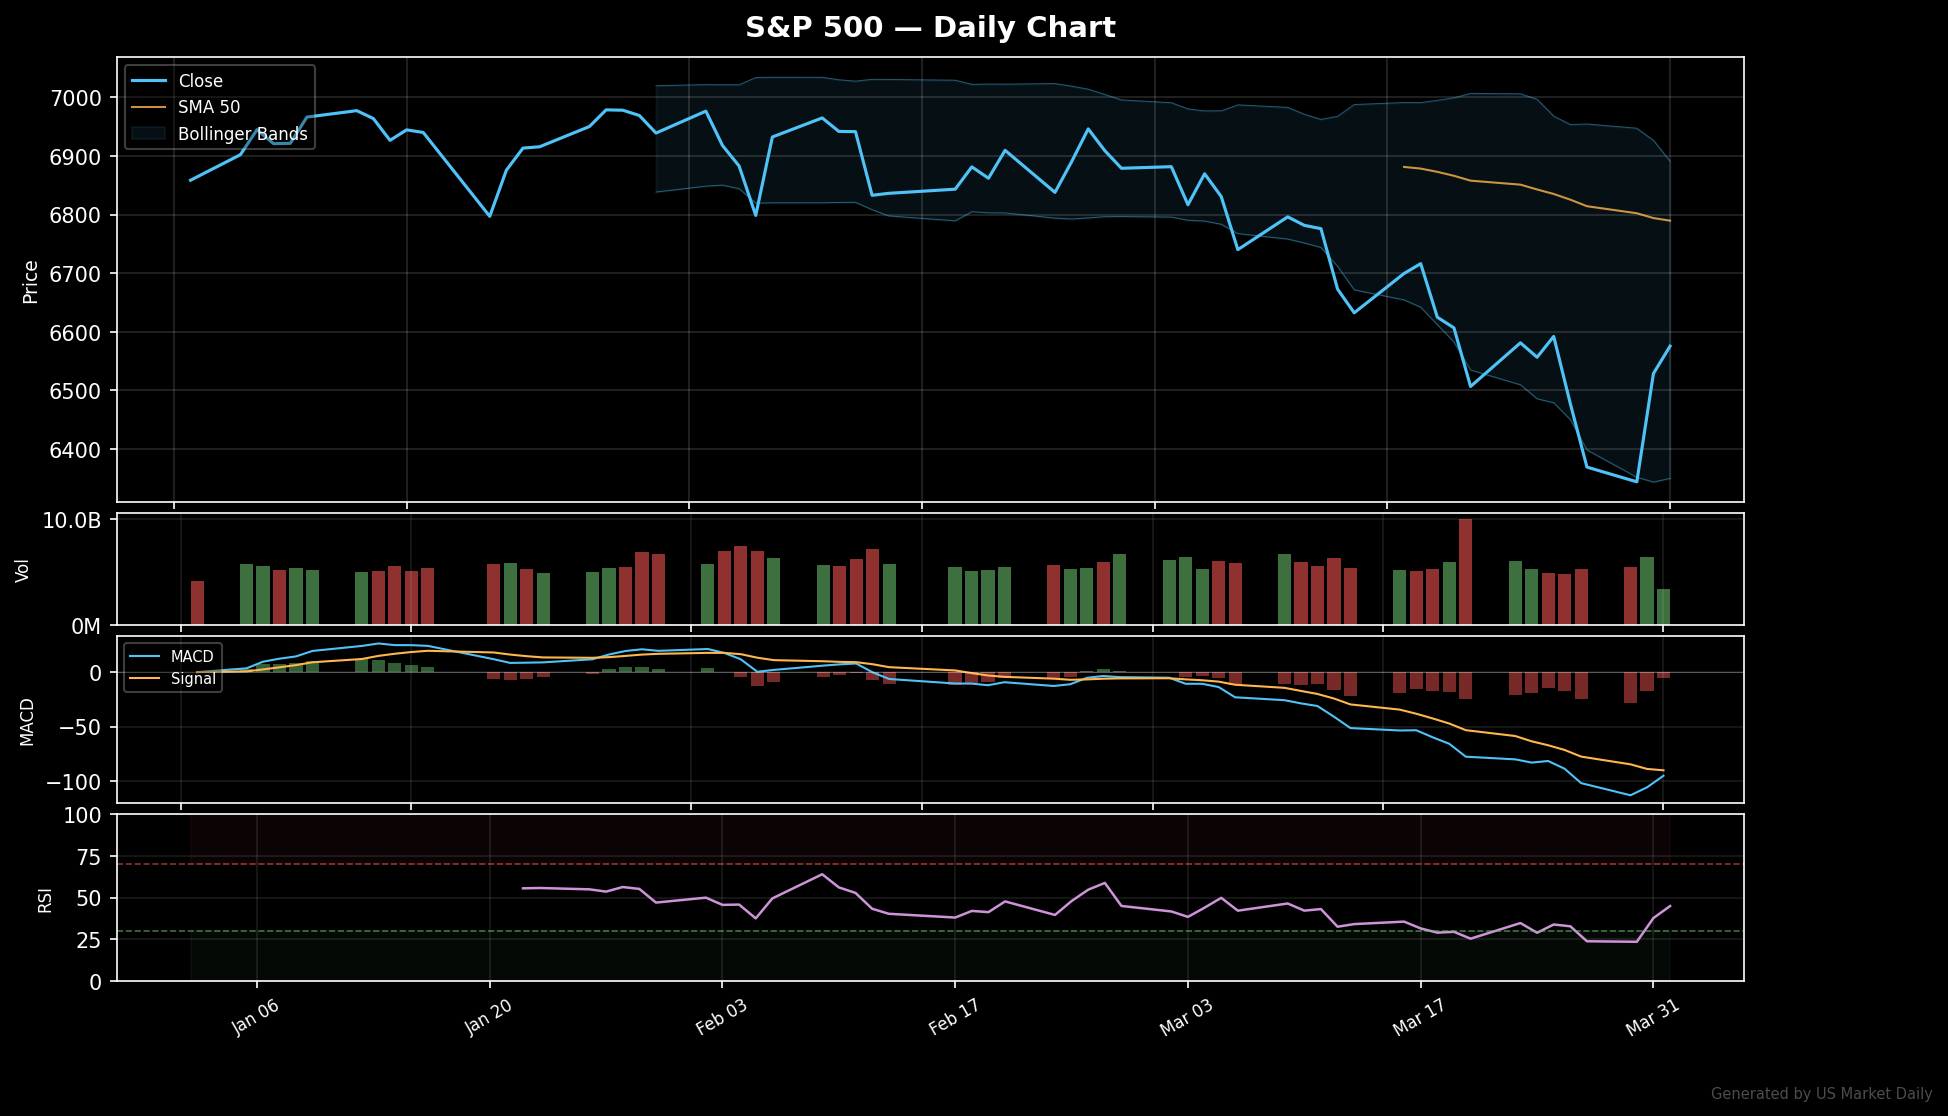
Technical indicators show mixed signals. The S&P 500 remains below its 50-day moving average at 6,789.49, with RSI at neutral 44.87. The MACD at -95.04 versus signal line -90.04 shows no clear momentum crossover, suggesting sideways consolidation continues despite today’s modest gains.
Small caps performed better than expected with the Russell 2000 gaining 0.63% to 249.56, though this remains insufficient to drive meaningful breadth expansion. High yield corporate bonds declined -0.24%, indicating credit markets aren’t fully embracing risk-on sentiment despite equity gains.
After-Hours Setup: Futures Point Higher Despite Internal Warning Signs
S&P 500 futures trade 0.78% higher at 6,622 in after-hours action, suggesting tomorrow could open with continued momentum. The real question isn’t the overnight bid—it’s whether breadth can finally catch up to index performance or whether concentration continues building fragility.
The key level to watch: 6,600 on the S&P 500 represents the session’s next meaningful resistance. A break above with expanding breadth would validate the rally, while failure with continued narrow participation would confirm internal deterioration despite surface strength.
Tomorrow’s focus includes any overnight crude oil developments that could extend Energy’s decline, and whether Technology names can maintain momentum after Intel’s outsized move. Gold’s 3.21% surge suggests defensive positioning isn’t fully unwound despite equity strength—a divergence worth monitoring closely.
Expectation vs. Reaction
Use this when the tape looks different from what options or positioning implied.
Engine verdict: Unresolved — Expected/actual gap unavailable, so treat follow-through as unresolved until more tape develops.
Implied vs actual: expected None% vs actual 0.7% (gap None pts).
Breadth / sector spread: breadth 1d -0.43 | breadth 5d -0.81 | ETF spread vs SPY None | basket spread vs SPY None.
Volume / follow-through: concentration 0.68 | state developing.
What breaks the reaction
- Breadth is not confirming the headline, which makes the move more fragile.
- Five-day breadth spread is -0.81, so participation still looks narrow.
Closest Historical Echo
A quick analog check so readers can compare this setup with prior commodity-shock tapes.
Closest echo: prior AI leadership bursts driven by semiconductor breadth and hyperscaler spending expectations.
What tended to matter then: the move lasts longer when SMH/SOXX breadth broadens beyond one leader and cloud demand names confirm the message
What is different now: This time actual price action is landing close to implied expectations, so confirmation breadth matters more than headline size. Breadth is narrowing, so the move looks more fragile than a broad market confirmation.
Recent internal echoes
- Stock Market, Mar 31, 2026: VIX Falls 2.32% to 30.33 But Fear Remains Elevated Preview
- Why Stocks Are Moving Today: Gold Surges 3.5% to $4,812 as Growth Regime Drives Commodity
- Why Stocks Are Moving Today: Breaking: Gold Surges +3.0% to $4,788.50 in Overnight Trading
Historical watchpoints for this setup
- SMH/SOXX breadth
- QQQ vs equal-weight tech
- customer-capex commentary from hyperscalers
- semiconductor breadth
The Market Translation: AI Capex
A tighter execution map for the theme behind today’s move.
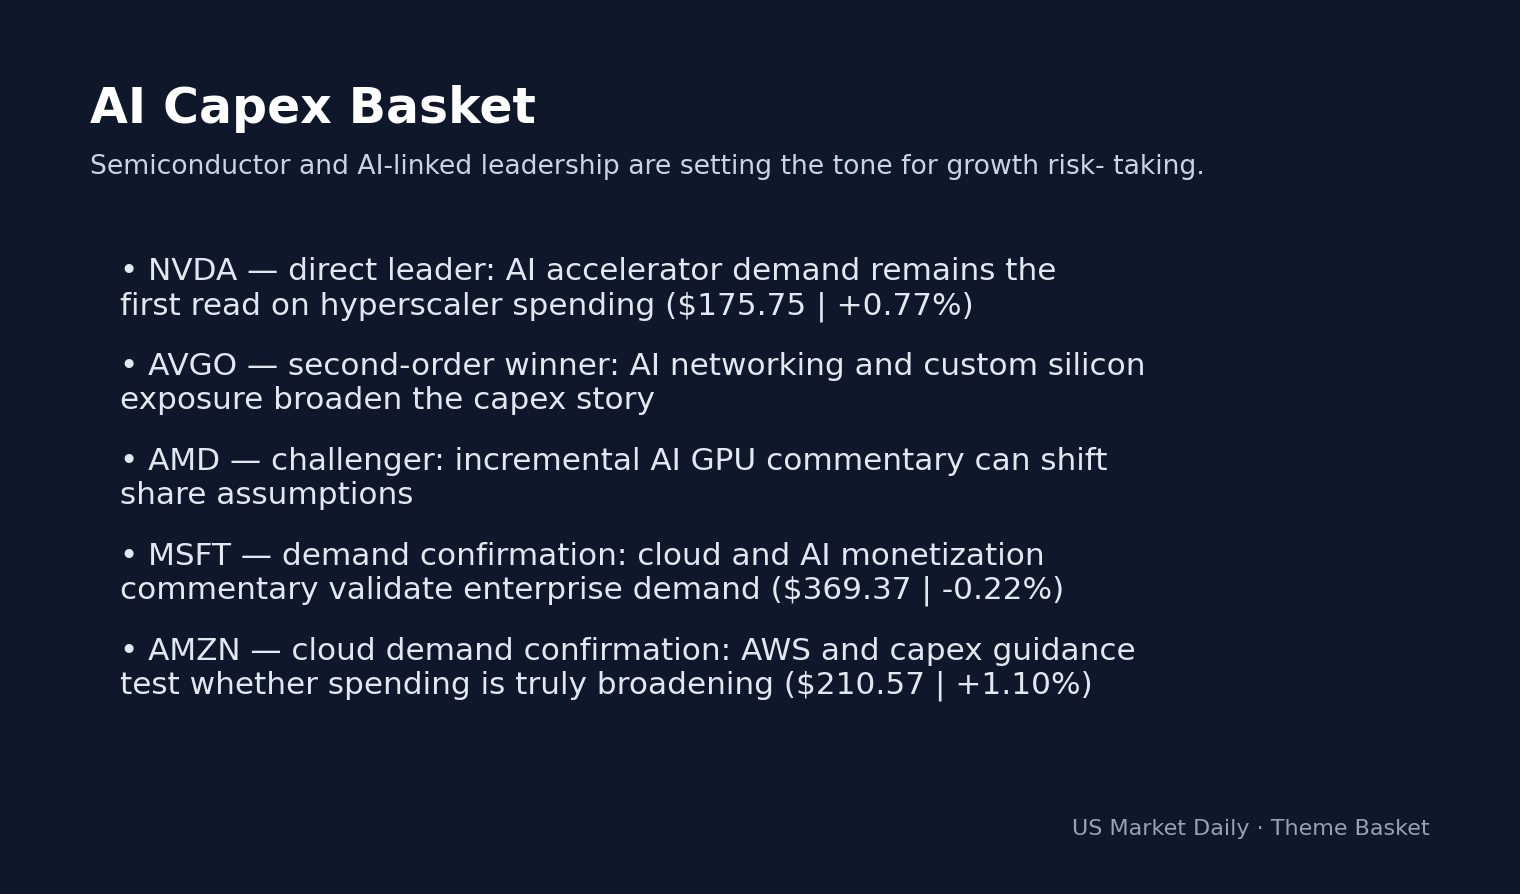
What this means: Semiconductor and AI-linked leadership are setting the tone for growth risk-taking.
What’s already priced in: options are implying roughly 0.26% moves around key events; NVDA is carrying one of the largest event bars in the tape
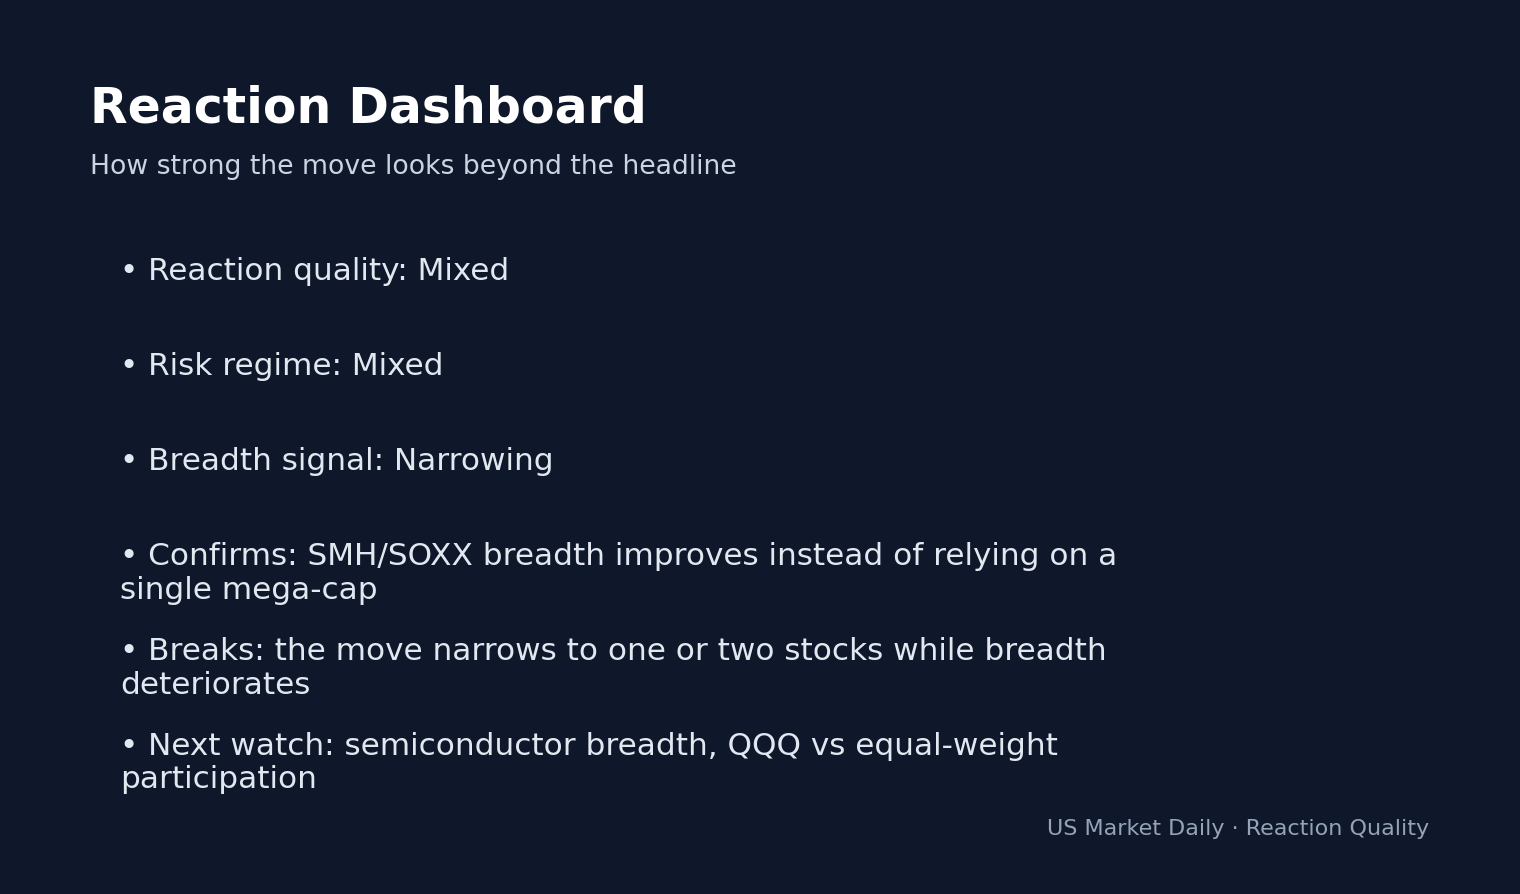
Reaction quality: Mixed confirmation
Stocks tied to this theme
- NVDA — direct leader. AI accelerator demand remains the first read on hyperscaler spending Recent action: $175.75 | +0.77%.
- AVGO — second-order winner. AI networking and custom silicon exposure broaden the capex story
- AMD — challenger. incremental AI GPU commentary can shift share assumptions
- MSFT — demand confirmation. cloud and AI monetization commentary validate enterprise demand Recent action: $369.37 | -0.22%.
- AMZN — cloud demand confirmation. AWS and capex guidance test whether spending is truly broadening Recent action: $210.57 | +1.10%.
Theme map
Theme map split into direct winners, second-order confirmations, crowded names, lagging names, and false friends to avoid ticker dumping.
Direct winners
- NVDA — direct leader. AI accelerator demand remains the first read on hyperscaler spending Recent action: $175.75 | +0.77%.
- AVGO — second-order winner. AI networking and custom silicon exposure broaden the capex story
Second-order beneficiaries
- MSFT — demand confirmation. cloud and AI monetization commentary validate enterprise demand Recent action: $369.37 | -0.22%.
- AMZN — cloud demand confirmation. AWS and capex guidance test whether spending is truly broadening Recent action: $210.57 | +1.10%.
Crowded names
- NVDA — direct leader. AI accelerator demand remains the first read on hyperscaler spending Recent action: $175.75 | +0.77%.
- AVGO — second-order winner. AI networking and custom silicon exposure broaden the capex story
Lagging names to watch
- MSFT — demand confirmation. cloud and AI monetization commentary validate enterprise demand Recent action: $369.37 | -0.22%.
False friends
- INTC — old-cycle semi. not every semiconductor headline is a clean AI-capex beneficiary
- AAPL — index passenger. can ride mega-cap momentum without being the cleanest AI capex expression Recent action: $255.63 | +0.73%.
ETFs and market gauges to watch
- SMH — semiconductor ETF. clean read on whether the AI trade is broad or narrow
- SOXX — chip ETF. useful to confirm breadth inside semis
- QQQ — mega-cap proxy. shows whether AI strength is moving the broader growth complex
What confirms the move
- SMH/SOXX breadth improves instead of relying on a single mega-cap
- cloud and networking names participate alongside the headline leader
- QQQ strength is confirmed by equal-weight tech participation
What would prove it wrong
- the move narrows to one or two stocks while breadth deteriorates
- high-expectation names fade despite positive headlines, signaling valuation fatigue
Look smart tomorrow
- semiconductor breadth
- QQQ vs equal-weight participation
- AI capex commentary from large customers
Playbook Memory
Internal reference notes from similar setups already covered on the site.
What this setup has looked like on this site: AI Capex playbook memory from 10 site examples | common sections: Recent internal echoes, What breaks the reaction, Historical watchpoints for this setup
Memory strength: strong | Tracked examples: 10 | Rewrite candidates: 0 | Refresh candidates: 0
Sections that usually mattered
- Recent internal echoes
- What breaks the reaction
- Historical watchpoints for this setup
- Stocks tied to this theme
Checks this setup usually needs
- Usual confirmation focus: SMH/SOXX breadth improves instead of relying on a single mega-cap
- Usual failure mode: the move narrows to one or two stocks while breadth deteriorates
- Current follow-through state: developing
Recent internal echoes
- Why Stocks Are Moving Today: Gold Spikes 3.2% to $4,798 as Metals Rally Despite Equity Strength
- Why Stocks Are Moving Today: Breaking: Gold Surges +3.5% to $2,410 as Haven Demand Spikes
- Why Stocks Are Moving Today: Gold Futures Jump 3.7% to $4,819.90 as Defensive Rotation Accelerates
- Why Stocks Are Moving Today: Gold Futures Spike 3.5% to $2,411 in Overnight Session
Tomorrow’s Playbook
Keep this one open if you want the forward-looking levels, confirms, and invalidation checklist.
Summary: Tomorrow's playbook for AI Capex: Semiconductor and AI-linked leadership are setting the tone for growth risk-taking. The opening check is whether confirmation broadens fast enough to overcome the risk that the headline fades once cash-session liquidity resets the tape.
Base case: treat the setup as developing and let the first hour decide whether the theme broadens or stalls.
Risk regime: mixed | Breadth: narrowing | Follow-through: developing
Opening 30-Minute Checks
- Watch whether ai capex leaders hold the opening range in the first 30 minutes.
- Cross-check the opening range and whether leadership broadens against breadth (narrowing) rather than the index alone.
- Treat an unresolved reaction with developing follow-through as tentative until volume and ETFs confirm.
Key Levels to Watch
- the opening range and whether leadership broadens
- 10Y yield around 4.32% as the rates cross-check.
- VIX around 24.54 as the volatility confirmation level.
If / Then Framework
- If smh/soxx breadth improves instead of relying on a single mega-cap, the market can keep leaning into ai capex.
- If the move narrows to one or two stocks while breadth deteriorates, downgrade the move to a headline reaction rather than a durable regime shift.
- If options are implying roughly 0.26% moves around key events; NVDA is carrying one of the largest event bars in the tape, focus on laggards and breadth instead of chasing the first winner.
What Confirms the Move
- SMH/SOXX breadth improves instead of relying on a single mega-cap
- cloud and networking names participate alongside the headline leader
What Invalidates the Move
- the move narrows to one or two stocks while breadth deteriorates
- high-expectation names fade despite positive headlines, signaling valuation fatigue
- Breadth is not confirming the headline, which makes the move more fragile.
- Five-day breadth spread is -0.81, so participation still looks narrow.
Next-Session Checklist
- semiconductor breadth
- QQQ vs equal-weight participation
- AI capex commentary from large customers
- SMH/SOXX breadth
- QQQ vs equal-weight tech
Options Interpretation / Sector / Industry Dispersion / Data Freshness
Supporting signals for readers who want the deeper tape, options, and breadth context.
Options Interpretation
Summary: implied moves are muted; IV premium is cheap; skew is balanced; term structure is back-loaded; OI positioning looks upside-chasing.
Regimes: implied move muted | IV premium cheap | skew balanced | OI positioning upside-chasing | term structure back-loaded.
Sector / Industry Dispersion
Wide Dispersion with broadly constructive breadth, selective participation under the surface, and a leader/laggard spread of 5.41 percentage points.
Rotation / participation profile
- Rotation state: balanced rotation
- Style tilt: growth leadership
- Cyclicals vs defensives: -0.25 pts
- Growth vs value: +1.60 pts
Dispersion leaders
- XLI: +1.67%
- XLK: +1.55%
- XLB: +1.00%
Dispersion laggards
- XLF: +0.06%
- XLP: -0.63%
- XLE: -3.74%
Data Freshness
Data is fresh for the after_hours tape with 2/6 source buckets populated; session alignment is aligned and intraday readiness is ready.
Session / freshness profile
- Market phase: after_hours
- Expected window: after_hours
- Session alignment: aligned
- Intraday readiness: ready
- Overnight carry: acceptable
Driver Profile Monitor
- INTC: drivers foundry execution, PC cycle; watch Intel Foundry losses, client computing recovery
- GOOGL: drivers search ad resilience, cloud profitability; watch Google Cloud margin, search revenue growth
- AMD: drivers AI GPU ramp, server CPU share gains; watch data center revenue, MI-series commentary
- CAT: drivers construction equipment demand, resource industries spend; watch dealer inventories, resource industries orders
Three Numbers That Matter
A compact frame for the three readings most worth carrying into the next session.
Three Numbers That Matter
- 10Y yield: 4.32% — Higher yields usually tighten the leash on long-duration growth and small-cap risk appetite.
- VIX: 24.54 — Volatility tells you whether the tape is confirming risk-taking or fading it.
- WTI crude: $99.22 — Crude often decides whether the theme stays isolated or spills into broader inflation and risk sentiment.
What’s Different This Time
- This time the market is dealing with a AI Capex setup rather than a generic macro headline.
- Breadth is narrowing, which makes the headline look stronger on the surface than it may be underneath.
Data sources: Yahoo Finance
📚 Related Articles
- Why Stocks Are Moving Today: Gold Surges +3.2% to $4,798 as Safe-Haven Demand Meets Equity Rally
- Stock Market, Mar 30, 2026: VIX Storms to 31 as Fear Overtakes Recovery
Explore the Market Internals Playbook
This article fits into our Market Internals topic cluster and is meant to serve what happened.
Evergreen angles to build next
- Why Breadth Matters More Than the Index Level — Teach readers how market breadth changes the quality of a rally or selloff.
- How to Spot a Healthy Rotation Versus a Weak Bounce — Use breadth, sector leadership, and volatility to distinguish durable moves from fragile rebounds.
- What Actually Moves Mega-Cap Tech Stocks — Map the real drivers behind hyperscaler, semiconductor, and platform stock reactions.
Cluster-adjacent reads
Market Internals Playbook
A hub for breadth, rotation, volatility, and the difference between a healthy rally and a fragile bounce.
Suggested reading path
- Learn the breadth basics
- Then map rotation versus bounce setups
- Use daily notes to apply the framework in real time
Core evergreen guides in this hub
- Why Breadth Matters More Than the Index Level — Teach readers how market breadth changes the quality of a rally or selloff.
- How to Spot a Healthy Rotation Versus a Weak Bounce — Use breadth, sector leadership, and volatility to distinguish durable moves from fragile rebounds.
Glossary anchors: breadth, participation, leadership, follow-through
Nothing in this article should be construed as a recommendation to buy or sell any security. Past performance does not guarantee future results.


