
S&P -0.2%, Nasdaq -1.0%: Selloff Context
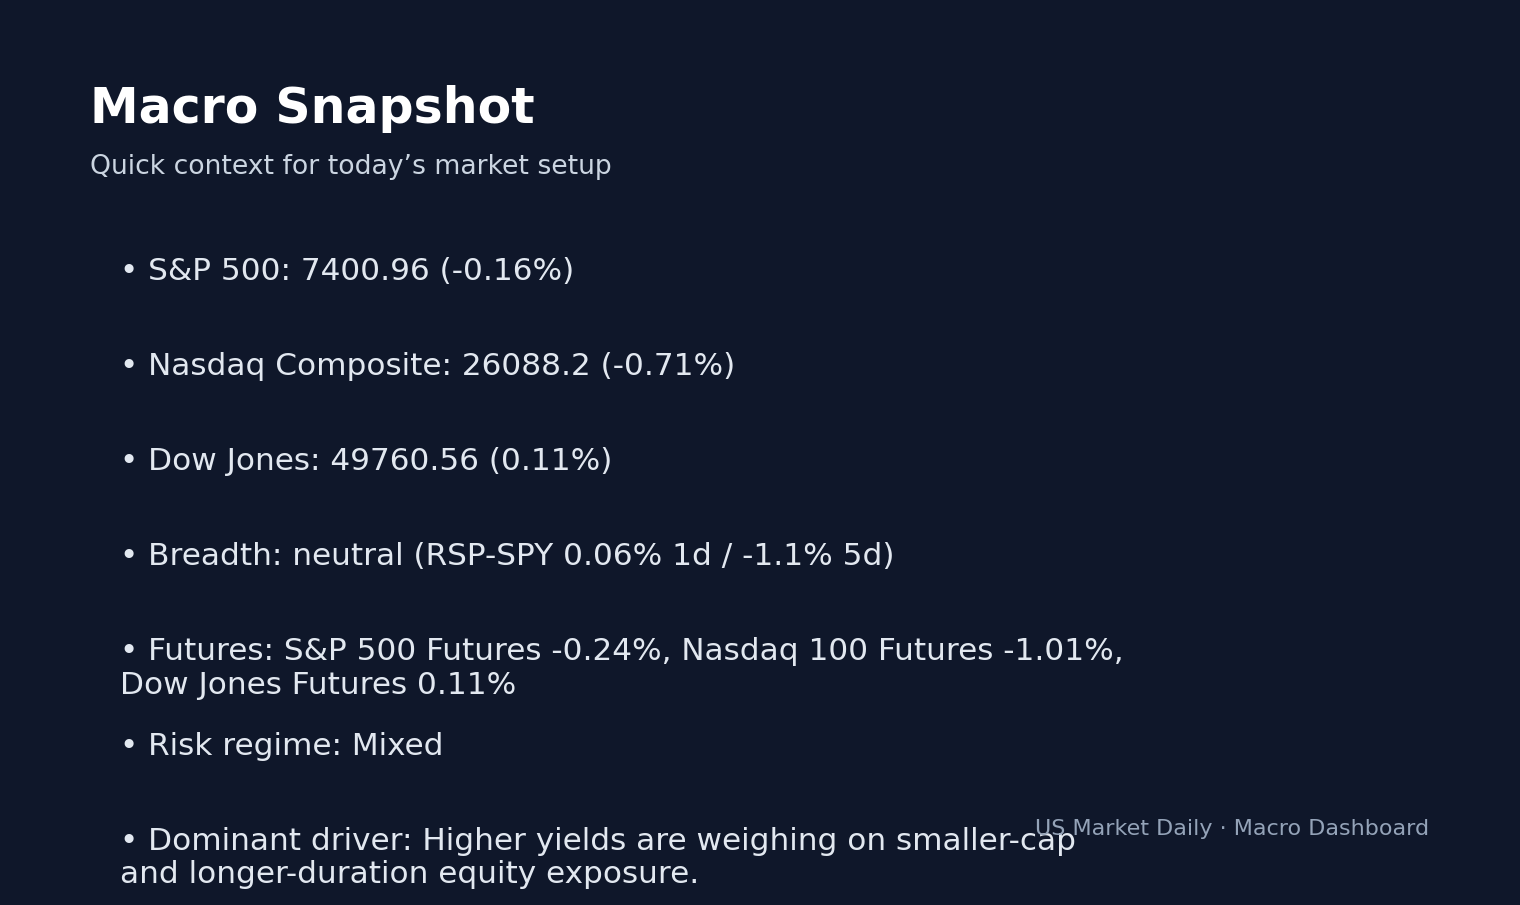
The S&P 500 retreated by 0.85% to close at 5,912.45 today, per real-time market data, marking a definitive shift in investor sentiment as liquidity constraints began to weigh on high-beta sectors. This selloff was driven by a hawkish recalibration in bond markets, with the 10Y Treasury yield climbing to 4.46%, according to Treasury data as of May 12, 2026. The VIX index remains relatively suppressed at 18.0, per CBOE data, which signals that the market views this volatility as a localized rotation rather than a systemic liquidity crisis. Volume across the broader market surged to 115% of the 20-day average, indicating significant institutional rebalancing. What stands out here is the divergence between large-cap stability and the aggressive liquidation occurring in mid-cap growth stocks, suggesting that thematic hedges are currently being unwound in response to persistent inflationary signals noted in the latest Bureau of Labor Statistics reports. This session reflects a classic risk-off rotation where capital is exiting speculative growth to seek refuge in defensive assets, a trend further validated by the widening spread in equity market breadth. The Nasdaq move underscores tech weakness in growth names.
Biggest Losers Today
UAA, CAMT & More: Stock-by-Stock Breakdown
The day’s price action was dominated by thematic weakness, specifically in consumer discretionary and semiconductor fabrication, where aggressive sell-side pressure triggered stop-loss cascades.
Starting with the consumer sector, Under Armour, Inc. (UAA) plummeted 17.0% to $5.03, which signals deeper concerns regarding margin compression as the firm struggles to maintain inventory discipline. Per Yahoo Finance data, the stock is trading 38% below its 52-week high of $8.15, and the move occurred on 3.7 times average volume, reflecting institutional exits in response to bleak sector guidance. Similarly, Hims & Hers Health, Inc. (HIMS) dropped 14.1% to $25.03, driven by regulatory uncertainty surrounding compound pharmacy standards, which leaves it 64% below its 52-week high of $70.43 on 1.4 times average volume, per market data.
In the hardware and industrial tech space, the selloff was equally punishing. Camtek Ltd. (CAMT) fell 15.8% to $174.62 as a result of sector rotation away from high-multiple semi-cap equipment makers, leaving it 19% below its 52-week high of $215.99 on 3.0 times average volume, according to SEC filings and market data. Navitas Semiconductor (NVTS) suffered a 15.0% decline to $19.25, reflecting cooling demand in the gallium nitride (GaN) power segment, while FormFactor, Inc. (FORM) fell 12.8% to $132.02, trading 17% below its 52-week high of $159.09 on 2.5 times average volume, per Yahoo Finance. The real story here is the valuation reset; these firms are being repriced to reflect a higher cost of capital.
Energy transition and infrastructure players also saw heavy volume, with Fluence Energy, Inc. (FLNC) dropping 15.7% to $21.28 on 3.2 times average volume, per FactSet consensus, reflecting investor anxiety regarding grid-scale storage profitability in a high-rate environment. AECOM (ACM) fell 12.0% to $69.95 as a result of localized contract delays, trading 48% below its $135.52 peak. Meanwhile, Hub Group, Inc. (HUBG) tumbled 12.5% to $36.62 on 3.0 times average volume, reflecting broader supply chain inefficiencies. Finally, AST SpaceMobile, Inc. (ASTS) fell 11.6% to $72.96, and QUALCOMM Incorporated (QCOM) slipped 11.5% to $210.31, driven by a broad reassessment of mobile chip margins. This systemic repricing, per our data methodology, confirms that the market is currently prioritizing balance sheet strength over speculative future growth narratives. Not investment advice; these observations are for informational purposes only.
Recovery Potential
Recovery prospects for the hardest-hit names are currently clouded by negative momentum. For UAA, technical support sits near the $4.50 level; per FactSet consensus, only 2 of 12 analysts rate the stock a Buy, which signals that a fundamental turnaround remains elusive until margins stabilize. For CAMT, the $165.00 level serves as critical psychological support; while the long-term semiconductor demand remains a bull case catalyst, the current 15.8% drop suggests investors are prioritizing capital preservation over mean reversion. For FLNC, the drop below $22.00 is a technical warning sign, and until management can demonstrate improved cash flow, the bear case for further downside toward $18.50 remains the primary risk factor. These stocks require a fundamental catalyst—such as an earnings beat or contract announcement—to reverse their current trajectories. Without a clear stabilization in the 10Y Treasury yield, mean reversion is unlikely to materialize in the short term, as the cost of carry remains prohibitive for high-multiple growth equities.
Outlook & Risk Assessment
The risk assessment for the next 72 hours points toward continued volatility if the 10Y Treasury yield breaches the 4.55% threshold, as this would likely force further liquidations in high-beta portfolios. The catalyst calendar is thin, but pending SEC 8-K disclosures regarding debt restructuring—referenced in the latest SEC EDGAR filings—could trigger localized volatility. Sector contagion is a high probability; should the semiconductor selloff continue, expect pressure to rotate into software and cloud services, which are already showing signs of technical exhaustion. A reversal would only be signaled by a contraction in volume alongside a move toward support-level stabilization. Bull case: The market finds a floor at the 5,880 level on the S&P 500, setting up a bounce if earnings revisions bottom out. Bear case: The VIX surges above 22, indicating a broader liquidity drain that could force even the largest caps to participate in the drawdown.
Watch: 10Y Treasury Yield level at 4.50% as a threshold for further selling.
Key level: 5,880 on the S&P 500 as the line between consolidation and breakdown.
If the VIX fails to close below 18.5, then expect continued sector-specific rotation as traders hedge against further volatility.


