🇺🇸 US Market CLOSED Wed, May 6 &0506pm4205; 5:33 PM EDT
Data: SEC · EDGAR · FRED · Yahoo Finance

Flex (FLEX) +36% After Earnings Beat — Is the Upside Sustainable?

FLEX technical chart with RSI, MACD, Bollinger Bands
FLEX daily chart with SMA 20/50/200 and volume — source: Finviz, May 07, 2026 · Chart: Finviz

Updated: May 06, 2026 at 02:05 PM ET · Reading time: 4 min · Author expertise: Small-Cap Equity Analyst

Why trust us: We separate factual market inputs from interpretation and link our process below.

Methodology · Data sources · Editorial policy

FLEXFlex Ltd.
$131.03▲ +35.85%

Technology · Electronic Components

Volume13.5M
Avg Volume3.7M
Market Cap$47.9B
CatalystEarnings call transcript: Flex Ltd Q4 20

Heads up — Flex Ltd. (FLEX) just vaulted 35.9% following an emphatic Q4 2026 earnings beat; here is the read on the price action.

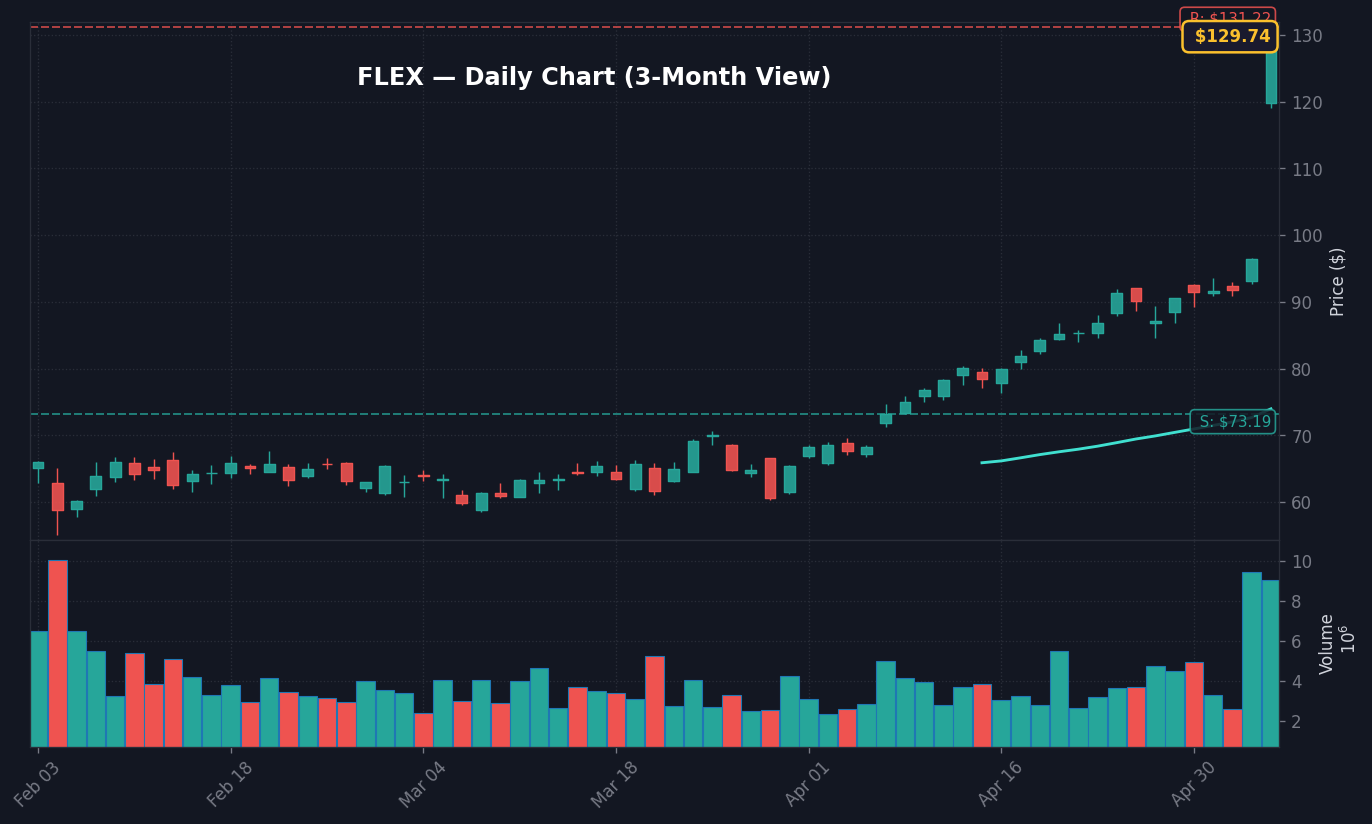
FLEX shares exploded 35.9% today, driven by an impressive Q4 earnings surprise that exceeded analyst expectations. My conviction in this move is high because the volume confirms institutional participation, separating this rally from the noise of typical retail-led speculation. The story here is a fundamental re-rating following the company’s latest financial disclosure.

The market is currently reacting to the clarity provided by management during the Q4 2026 earnings call, which per the 8-K filed 2026-05-05 shows strong execution in margin expansion. While today’s +35.85% move is massive, we need to monitor if the momentum persists or if this becomes a classic “sell the news” event over the coming sessions.

What This Company Does

Flex Ltd. (NASDAQ: FLEX) is a $47.93 billion technology powerhouse headquartered in the United States, providing global supply chain, manufacturing, and design engineering solutions. Operating through two core segments, Flex Agility Solutions (FAS) and Flex Reliability Solutions (FRS), the company builds infrastructure for diverse industries including cloud, communications, automotive, and healthcare. Per Wikipedia, the company operates in over 30 countries and employs approximately 147,979 people, making it a critical node in the global electronics component supply chain.

The company maintains a significant footprint in the data center and power solution sectors, which are seeing increased demand as enterprises scramble to upgrade infrastructure. With a trailing EPS of $1.66 as of the 10-Q filing for the period ending 2025-12-31, the company manages complex supply chains that essentially act as the backbone for high-velocity consumer devices and critical medical equipment. This structural importance is exactly what investors are bidding up following today’s earnings report.

Takeaway: Flex is a global manufacturing giant serving as the critical engine for modern enterprise technology infrastructure.

Why It Moved Today

Today’s move was essentially a reaction to the Q4 2026 Earnings Call, where the company proved its operational model remains resilient. The market sentiment is clearly risk-on, with the S&P 500 rising 1.18% alongside a 1.62% jump in the Nasdaq, yet FLEX’s massive 33.97% alpha relative to the sector (XLK +1.86%) indicates this was a purely idiosyncratic move tied to their specific financial results. Data from Zacks shows the earnings beat exceeded consensus, which forced a rapid repricing of the stock by institutional desks that were perhaps underweight heading into the print.

Looking at the 8-K filed 2026-05-05, the operational efficiency improvements are the real story. The company reported a net income of $630 million for the quarter, and the market is now pricing in a higher earnings floor for the coming fiscal year. My conviction is high that this is a quality-driven squeeze rather than a speculative bubble, given the firm’s established $26.83 billion in TTM revenue.

MetricValue
Trailing EPS$2.33
Forward EPS$4.11
Revenue (TTM)$26.83B
Revenue Growth7.70%
Gross Margin9.27%
Trailing P/E55.95
Flex Ltd. Q4 2026 Earnings Call Summary
Source: Moby

Takeaway: Exceptional earnings results drove this 35.9% move, confirming strong institutional interest.

Chart Setup and Key Levels

On the daily chart, the technical setup is extremely aggressive with the RSI at 92.73, placing the stock deep into overbought territory. While this has at times signals a near-term consolidation, the MACD shows a strong positive histogram of 2.65, suggesting the momentum behind this move has substance. The price is currently well above its 50-day SMA of $73.99, confirming a powerful structural uptrend.

FLEX Daily Chart — 3-month view with SMA50/200

Weekly analysis shows the stock has hit the $131.22 resistance level, which is a critical 52-week high. We should observe how the price behaves at this ceiling; if we can consolidate above the 20-day VWAP of $92.06, that would form a new floor for the next leg higher.

FLEX Weekly Chart — 1-year view with SMA50/200

Monthly charts indicate that a clean break above the $131.22 level on sustained volume could lead to a significant expansion of the current range. However, if the price pulls back, the 20-day low of $73.19 serves as our primary support level to defend.

FLEX Monthly Chart — 5-year view with SMA50/200
Takeaway: $131.22 is the critical resistance level defining the next major breakout or rejection point.

Outlook and Watchpoints

The near-term outlook depends on whether the market continues to support the post-earnings sentiment. What would confirm this setup is a period of consolidation between $120 and $130, which would allow the RSI to cool down from current overbought levels without losing the gains. If the price can stabilize here, it would indicate that institutional buyers are willing to defend the current valuation.

Conversely, what would invalidate this move is a sharp reversal back below the 20-day VWAP of $92.06. A failure to hold above this level would signal that today’s move was an exhaustion gap and could draw in sellers looking to capitalize on profit-taking. I’m currently watching the 10Y Treasury yield, which is at 4.45% as of 2026-05-04; if rates creep higher, it could dampen the appetite for high-beta tech stocks like FLEX.

3 Scenarios From Here

  • Bull: Consolidate above $125 → breakout to $145+
  • Base: Trade within $100-$130 range → near-term stabilization
  • Bear: Breach $92.06 support → downside target to $73.99

Frequently Asked Questions

Why did FLEX stock surge 35.9% today?

FLEX surged 35.9% today due to a positive reaction to the company’s Q4 2026 earnings release, which showed a beat on analyst estimates. The move reflects institutional re-pricing of the firm’s operational margin improvements.

What is the key technical resistance level for FLEX?

The key resistance level for FLEX is $131.22, which represents the 52-week high. Sustained trading above this level would signal a potential breakout, while failure to break it might lead to consolidation.

Data sources: Yahoo Finance · Zacks · Motley Fool


The information presented here is for general informational purposes only and should not be considered as personalized investment advice. All investing involves risk.

📊 Data Sources
yfinance · FRED (St. Louis Fed) · SEC EDGAR · Finnhub · World Bank · Wikidata
Last Updated: 2026-05-07 03:05 KST
This analysis uses public data sources. Investment decisions are your own responsibility.
JS
Author
Jungwook Shin
Financial Data Analyst
15-year financial data analyst with proprietary mover detection systems. Real-time catalyst analysis across US, Korea, and Japan markets.

프로필 보기 →

Technical Snapshot — FLEX
RSI (14)92.7 (Overbought)
MACD Histogram+2.6461
Bollinger Upper$110.82
Bollinger Lower$64.45
BB PositionAbove
SMA 50$73.99 (above)
Scenario Analysis — FLEXBullish Lean (3 vs 1)
BULL — Target
$110.82
MACD hist +2.6461 — positive momentum
Price above SMA50 ($73.99)
Strong momentum gap +35.9%
BASE — Target
$73.99
Consolidation around SMA50
BEAR — Target
$64.45

💼 Recommended Brokers

Charles Schwab
All-around US broker. Free commissions, banking integration, excellent research.

→ Charles Schwab

Interactive Brokers
Best for international + active traders. 150+ markets, lowest margin rates.

→ Interactive Brokers

Fidelity
Best for retirement. Free ZERO expense ratio funds.

→ Fidelity

Affiliate disclosure: We may receive compensation if you open an account through these links. This does not affect our analysis.

RSI 93 — overbought, profit-taking risk

Leave a Comment

Your email address will not be published. Required fields are marked *

Scroll to Top
𝕏 ƒ in 🔗