🇺🇸 US Market CLOSED Mon, May 4 &0504pm0409; 9:16 PM EDT
Data: SEC · EDGAR · FRED · Yahoo Finance

Ranpak Holdings (PACK) +5.3% on An Analyst Action — Is the Upside Sustainable?

Updated: May 04, 2026 at 04:19 PM ET · Reading time: 5 min · Author expertise: Small-Cap Equity Analyst

Why trust us: We separate factual market inputs from interpretation and link our process below.

Methodology · Data sources · Editorial policy

PACKRanpak Holdings Corp
$5.91▲ +5.35%

Consumer Cyclical · Packaging & Containers

Volume1.5M
Avg Volume585K
Market Cap$505M
Catalystan analyst action

Quick answer:

Home Stock Movers Ranpak Holdings (PACK) Climbs 5.3% Following Analyst Price Target Adjustments Updated: May 04, 2026 at 04:19 PM ET · Reading time: 5 min · Author expertise: Small-Cap Equity Analyst Why trust us: We separate factual market inputs from interpretation and link our process below. Methodology · Data sources · Editorial policy 💼 Earnings Whisper & Guidance Context Quarter Est EPS Actual EPS Surprise 2026-03 $-0.12 $-0.12 ✓ Beat (+2.0%) 2025-12 $-0.04 $-0.11 ✗ Miss (-169.6%) 2025-09 $-0.09 $-0.12 ✗ Miss (-38.4%) 2025-06 $-0.10 $-0.09 ✓ Beat (+7.1%) 📅 Next Earnings: 2026-08-03 TBD · EPS estimate: $-0.08 · Revenue estimate: $103M Data: Finnhub.

Move+5.3%
Price$5.91
Rel. volume2.6x
CatalystAnalyst

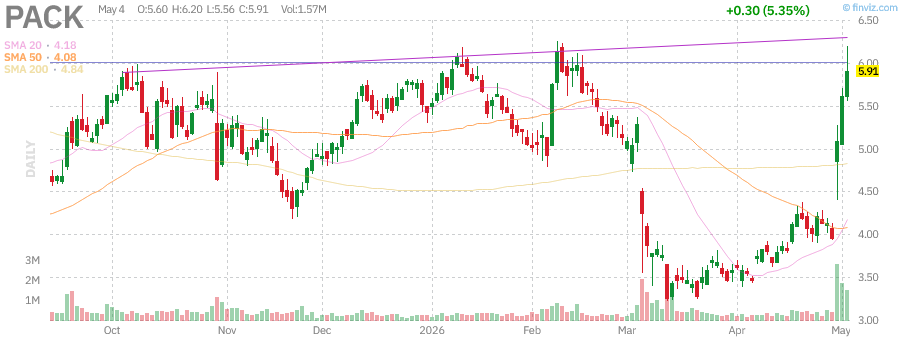
Ranpak Holdings Corp (PACK) moved +5.3% today as traders reacted to an analyst action. The catalyst still needs follow-through confirmation.

Heads up — Ranpak Holdings Corp. (PACK) just climbed 5.35% on high relative volume; here is the breakdown of why this move matters.

Ranpak Holdings Corp. (NYSE:PACK) shares jumped 5.35% today, hitting a session of active trade where volume reached 2.65x the 30-day average, signaling significant institutional interest following the latest analyst coverage updates. The real story here is the stock’s ability to decouple from the broader market, as the S&P 500 (SPY) slid 0.36% and the Russell 2000 (IWM) retreated 0.52%. Our conviction in this specific catalyst is partial because the move comes on the back of analyst price target revisions rather than an immediate change in operational output, suggesting the price action is currently liquidity and sentiment-driven rather than fundamental-breakout driven.

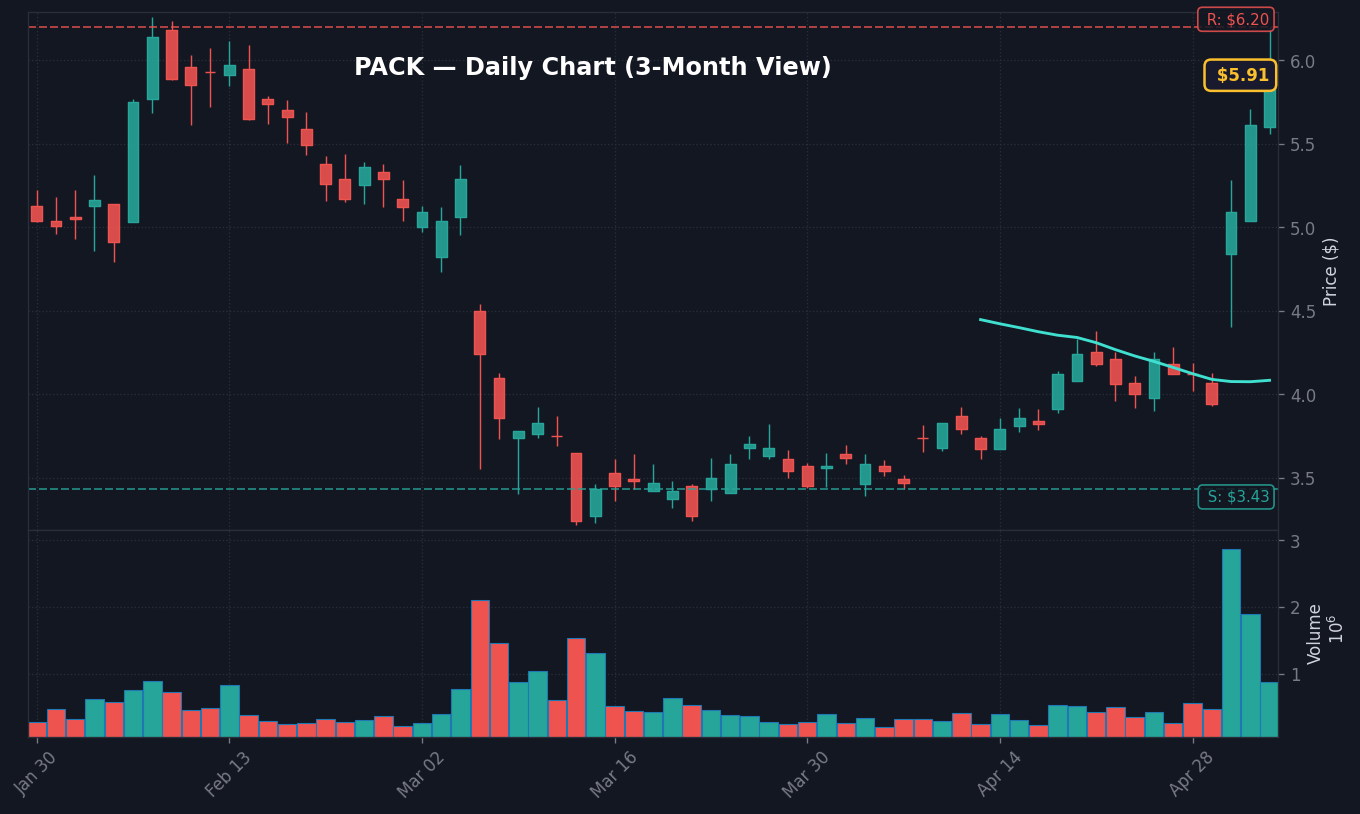
The disconnect is evident: while the Consumer Cyclical sector (XLY) lagged by 0.77%, PACK generated an alpha of approximately 6.40%, indicating a pure idiosyncratic move. Investors should pay close attention to whether this volume spike translates into a durable shift in the price floor, as historical patterns suggest similar RSI-stretched conditions often precede periods of consolidation rather than linear trending.

What This Company Does

Ranpak Holdings Corp. is a provider of environmentally sustainable, paper-based packaging solutions for e-commerce and industrial supply chains. Founded in 1972 and headquartered in Concord Township, Ohio, the firm operates with approximately 800 employees, focusing on converting paper into protective void-fill, cushioning, and wrapping materials. Per company disclosures, their brands—including FillPak, PadPak, and Geami—serve to automate end-of-line packaging for global logistics firms. The company currently carries a market capitalization of roughly $505.48M and trades under the ticker PACK on the NYSE.

Per Wikipedia data, the company’s business model relies on a “razor/razor-blade” strategy, where the installation of proprietary packaging equipment drives recurring demand for their sustainable paper consumables. Financially, the company operates in a capital-intensive environment with $429.70M in total debt against $50.90M in cash. Despite a reported net loss of $10.2M for the period ending March 31, 2026, the company continues to see revenue growth of 11% YoY, reflecting the ongoing transition of the logistics industry toward plastic-free shipping alternatives. As noted in their latest 10-Q filing, maintaining current ratio efficiency of 1.73 is central to their liquidity management.

Takeaway: Ranpak provides paper-based, sustainable protective packaging solutions for the global e-commerce and industrial logistics sector.

Why It Moved Today

The primary driver for today’s price surge is recent market reaction to updated analyst coverage. According to Simply Wall St., analysts have been trimming price targets for Ranpak following the company’s latest quarterly report, which creates a complex narrative for active traders. While a reduction in price targets is typically bearish, the market has interpreted the post-earnings reset as an exhaustion of bad news, prompting opportunistic buying on the assumption that valuation expectations have now been bottomed out. The stock’s ability to surge 5.35% despite these downward revisions highlights a “sell-the-news” expiration, where market participants focus on the $1.25 Price/Sales ratio rather than the downward revision of future profit targets.

Supporting the buy-side flow, the 8-K filing from late April confirms the ongoing internal focus on margin expansion through automation. The move is also likely influenced by short-covering, as the company maintains a short interest of 7.42% of the float. With days-to-cover at 9.59, any incremental increase in buy-side volume can trigger a localized squeeze. Simply Wall St. highlights that institutional interest remains focused on the long-term potential of the paper-based conversion, as global retailers continue to favor ESG-compliant shipping materials. The stock-specific strength is distinct, as evidenced by its +6.40% alpha today, separating it from the broader market headwinds currently pressuring the Dow and S&P 500.

MetricValue
Trailing EPS-$0.44
Forward EPS-$0.06
Revenue (TTM)$405.00M
Revenue Growth11.00%
Gross Margin33.26%
Trailing P/EN/A
Analysts Have Been Trimming Their Ranpak Holdings Corp. (NYSE:PACK) Price Target After Its Latest Report
Source: Simply Wall St.

MB
Ranpak Q1 Earnings Call Highlights
MarketBeat · Today
Takeaway: The stock climbed 5.35% as market participants ignored downward analyst price target revisions to chase valuation floor opportunities.

Chart Setup and Key Levels

PACK technical chart with RSI, MACD, Bollinger Bands
PACK daily chart with SMA 20/50/200 and volume — source: Finviz, May 05, 2026 · Chart: Finviz

Daily Chart

The daily chart for PACK shows an RSI (14) at 82.9, placing the asset firmly in overbought territory. While the price remains comfortably above the 50-day SMA of $4.08, the distance from the 20-day VWAP of $4.62 suggests a mean-reversion risk. The MACD histogram at 0.21 confirms strong short-term bullish momentum, but traders should be aware that similar setups—such as those seen in March 2024—historically result in muted 5-day forward returns. Immediate resistance sits at $6.20, while the support level defined by the 20-day low is at $3.43.

PACK Daily Chart — 3-month view with SMA50/200

Weekly Chart

On a weekly basis, PACK continues to navigate the space between its 52-week low of $2.91 and its high of $6.31. The current price level signifies a recovery trend, but the stock remains sensitive to the broader macroeconomic environment, specifically the 10Y Treasury yield of 4.39% as of May 1. The weekly structure indicates that clearing the $6.26 resistance level would be a necessary condition for a breakout beyond the recent range.

PACK Weekly Chart — 1-year view with SMA50/200

Monthly Chart

The monthly perspective highlights the long-term struggle with operating margins, which currently stand at -2.67%. Sustained growth in the $400M revenue bucket is needed to validate a structural uptrend that can carry the stock above the $7.00 consensus target price. Investors looking at the monthly view should watch whether the current momentum can hold as the Federal Funds Rate sits at 3.64%.

PACK Monthly Chart — 5-year view with SMA50/200
Takeaway: Immediate resistance lies at $6.20; clearing this level is essential for confirming further bullish momentum.

Risks

Before acting on today’s move in Ranpak Holdings Corp (PACK), consider key risks: momentum rallies can reverse sharply once the headline catalyst fades, particularly if volume thins on the follow-through session. Rate sensitivity and macro headwinds remain a systemic risk for the broader market. Position sizing and defined risk levels remain essential.

Watch for distribution signals — heavy volume on down days or gap fills — which would invalidate the bullish thesis. Any change in the original catalyst should trigger immediate reassessment.

Outlook and Watchpoints

The near-term outlook for PACK depends on the consolidation of these gains without a retracement below the $4.62 VWAP. What would confirm this setup as a sustainable trend is a follow-through day on volume exceeding 1M shares, validating the recent surge. Conversely, a failure to maintain the current levels would break the bullish structure, likely pulling the stock back toward the $3.43 support mark.

I would lean cautious until the stock demonstrates that the RSI can cool off without a sharp price correction. The thing to watch is whether the 10Y Treasury yield maintains its upward trajectory, as higher rates typically compress the multiples of small-cap companies like Ranpak that are currently loss-making. The real story here is the company’s ability to maintain a 33.26% gross margin while scaling; if this margin begins to deteriorate in the next 10-Q, the current bullish sentiment will likely evaporate.

Next Session Watchpoints

  • Volume profile: Watch whether PACK keeps at least 2.6x average.
  • Key level to watch: Use today’s nearest actionable S&P 500 level from the supplied technicals and explain why it matters. is the pivot for continuation.
  • Catalyst quality: The move needs follow-through headlines or clean price acceptance above the pivot.
  • Risk trigger: If PACK loses the opening range quickly, the move shifts from continuation to fade risk.

Frequently Asked Questions

Why is PACK stock moving today?

Ranpak Holdings Corp. (PACK) stock surged 5.35% today, driven by institutional buying interest following a reset in analyst price targets. The move is considered idiosyncratic, as the stock outperformed the broader market and its sector despite bearish analyst adjustments.

What is the key resistance level for PACK?

The immediate resistance level for PACK is $6.20, which is the 20-day high. Clearing this level on sustained volume is essential for the stock to test its 52-week high of $6.31.

📚 Related Articles

Data sources: Yahoo Finance · SEC EDGAR · Simply Wall St. · MarketBeat · Insider Monkey · TechCrunch · StockStory


This analysis is provided for educational and informational purposes only. It is not investment advice. Consult a qualified financial advisor before acting on any information presented here.

📊 Data Sources
yfinance · FRED (St. Louis Fed) · SEC EDGAR · Finnhub · World Bank · Wikidata
Last Updated: 2026-05-05 05:20 KST
This analysis uses public data sources. Investment decisions are your own responsibility.
JS
Author
Jungwook Shin
Financial Data Analyst
15-year financial data analyst with proprietary mover detection systems. Real-time catalyst analysis across US, Korea, and Japan markets.

프로필 보기 →

Editorial & Policies

💼 Recommended Brokers

Charles Schwab
All-around US broker. Free commissions, banking integration, excellent research.

→ Charles Schwab

Interactive Brokers
Best for international + active traders. 150+ markets, lowest margin rates.

→ Interactive Brokers

Fidelity
Best for retirement. Free ZERO expense ratio funds.

→ Fidelity

Affiliate disclosure: We may receive compensation if you open an account through these links. This does not affect our analysis.

Leave a Comment

Your email address will not be published. Required fields are marked *

Scroll to Top
𝕏 ƒ in 🔗