🇺🇸 US Market CLOSED Mon, Apr 27 &0427pm0008; 8:18 PM EDT
Data: SEC · EDGAR · FRED · Yahoo Finance

ABSI Stock Analysis: Why Shares Are Surging Today

Updated: April 27, 2026 at 04:17 PM ET · Reading time: 4 min · Author expertise: Small-Cap Equity Analyst

Why trust us: We separate factual market inputs from interpretation and link our process below.

Methodology · Data sources · Editorial policy

ABSIAbsci Corporation
$4.85▲ +23.10%

Healthcare · Biotechnology

Volume11.3M
Avg Volume3.8M
Market Cap$754M
Catalysta filing or capital-markets development

Quick answer:

Home Stock Movers Absci (ABSI) Surges 23.1% on Capital Markets Development Filing Updated: April 27, 2026 at 04:17 PM ET · Reading time: 4 min · Author expertise: Small-Cap Equity Analyst Why trust us: We separate factual market inputs from interpretation and link our process below. Methodology · Data sources · Editorial policy 💼 Earnings Whisper & Guidance Context Quarter Est EPS Actual EPS Surprise 2025-12 $-0.20 $-0.20 ✗ Miss (-0.9%) 2025-09 $-0.22 $-0.20 ✓ Beat (+7.4%) 2025-06 $-0.22 $-0.24 ✗ Miss (-11.0%) 2025-03 $-0.23 $-0.21 ✓ Beat (+10.5%) 📅 Next Earnings: 2026-05-07 TBD · EPS estimate: $-0.21 · Revenue estimate: $2M Data: Finnhub.

Move+23.1%
Price$4.85
Rel. volume3.0x
CatalystFiling

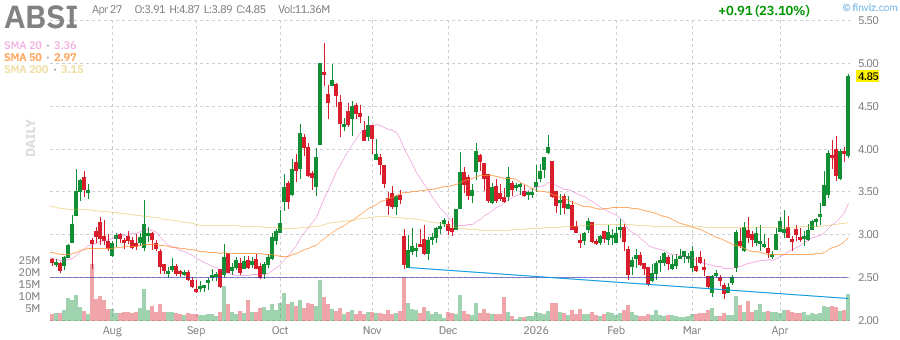
Heads up — ABSI just jumped 23.1% on a significant capital markets filing; here is the breakdown of the move.

Absci Corporation (NASDAQ:ABSI) shares surged 23.1% to reach a new local high, driven by the release of a fresh capital markets filing. The market is reacting to the company’s strategic disclosure, which suggests a shift in financial positioning for the biotechnology developer. My read on this move is that it reflects a repricing of the firm’s liquidity outlook, though the sustainability of these gains depends on how quickly investors move past the initial headline-driven volatility.

What stands out here is the volume accompanying this surge. With 11.3 million shares traded—a relative volume of 3.01x the daily average—the buying pressure appears institutional. While the stock has a high short interest of 28.1%, the move looks more like a fundamental reaction to the 8-K filing dated 2026-03-24 than a pure short squeeze.

What This Company Does

Absci Corporation is a clinical-stage biotechnology firm headquartered in Vancouver, Washington, focused on developing antibody therapeutics through its proprietary AI-integrated platform. Per Wikipedia, the company targets complex therapeutic areas, including inflammatory bowel disease and androgenic alopecia. Operating with a market cap of approximately $753.9 million, Absci works on programs like ABS-101 and ABS-201 to modernize drug discovery processes.

The company maintains significant research collaborations with entities such as Memorial Sloan Kettering and AMD to push its technology forward. Despite significant operational expenditures common to clinical-stage firms, Absci’s partnerships serve as a key pillar for its research and development pipeline. Their current asset base of $245.0 million, as noted in the most recent SEC filing, highlights the capital-intensive nature of their drug development efforts.

Takeaway: Absci is an AI-driven biotech firm focused on clinical-stage antibody therapeutics and drug discovery partnerships.

Why It Moved Today

The +23.1% move is directly tied to the latest capital markets disclosure. According to Insider Monkey, the update provides a clearer window into the firm’s potential, which traders are currently pricing in as a positive indicator for future funding or partnership strength. This jump creates a significant alpha of 22.66% against the S&P 500, which only gained 0.16% today, signaling that this is a pure idiosyncratic move rather than a sector-wide rotation.

My conviction in this catalyst is partial. While the filing is official, the market’s enthusiasm for biotech capital structures often undergoes quick mean reversion. We are seeing a divergence from the broader Healthcare sector (XLV), which fell 0.50% today. This suggests that the market is treating ABSI as a special situation rather than a proxy for the wider biotech industry.

MetricValue
Trailing EPS-$0.84
Forward EPS-$0.63
Revenue (TTM)$2.80M
Revenue Growth-2.30%
Gross Margin0.00%
Trailing P/EN/A
Absci Corp. (ABSI) Offering Impressive Upside to Potential Investors
Source: Insider Monkey

Takeaway: Capital markets filing triggered institutional buying, with moderate confidence in the sustained impact.

Chart Setup and Key Levels

ABSI technical chart with RSI, MACD, Bollinger Bands
ABSI daily chart with SMA 20/50/200 and volume — source: Finviz, April 28, 2026 · Chart: Finviz

Daily Chart

ABSI is currently overbought with an RSI of 86.97. Price action has pushed above the upper Bollinger Band of $4.42, indicating that the move may be overextended in the very near term. Support currently holds at the 20-day low of $2.71, while resistance is established at the 20-day high of $4.87.

ABSI Daily Chart — 3-month view with SMA50/200

Weekly Chart

On a weekly basis, the stock is showing robust 5-day momentum of +22.8%, well above the 50-day moving average of $2.97. The historical context is mixed; when looking at the last 11 similar setups, the 5-day forward return has been highly volatile, ranging from -37% to +50%. We must be careful not to extrapolate the current optimism too far.

ABSI Weekly Chart — 1-year view with SMA50/200

Monthly Chart

The monthly trend reflects a recovery from the 60-day low of $2.24. For this trend to hold, the stock needs to digest today’s massive volume spike without slipping back below the $3.50 VWAP level. If we see a failure to hold that VWAP, the setup would likely invalidate, suggesting a return to the mean.

ABSI Monthly Chart — 5-year view with SMA50/200
Takeaway: Resistance at $4.87 is the level to watch; clearing it would confirm a major breakout.

Outlook and Watchpoints

The immediate path for ABSI involves holding above the $3.50 VWAP level. If the stock maintains this base, we could see a push toward the $4.87 resistance mark. However, given the overbought RSI of nearly 87, I would expect a cooling-off period. What would confirm this bullish setup is a successful retest of $3.50 followed by a breakout past $4.87 on similar high-volume participation.

Conversely, the risk of invalidation is high if the price breaks below the $3.50 level, as it would likely trigger profit-taking from those who entered during this 23% gap up. I’d lean cautious here until the RSI retreats toward the 60-70 range, indicating the momentum has stabilized. The primary trigger for further movement will be any secondary news regarding the specific capital usage outlined in the recent 8-K filing.

Risks

Before acting on today’s move in Absci Corporation (ABSI), consider key risks: momentum rallies can reverse sharply once the headline catalyst fades, particularly if volume thins on the follow-through session. Rate sensitivity and macro headwinds remain a systemic risk for the broader market. Position sizing and defined risk levels remain essential.

Watch for distribution signals — heavy volume on down days or gap fills — which would invalidate the bullish thesis. Any change in the original catalyst should trigger immediate reassessment.

Next Session Watchpoints

  • Volume profile: Watch whether ABSI keeps at least 3.0x average.
  • Key level to watch: Use today’s nearest actionable S&P 500 level from the supplied technicals and explain why it matters. is the pivot for continuation.
  • Catalyst quality: The move needs follow-through headlines or clean price acceptance above the pivot.
  • Risk trigger: If ABSI loses the opening range quickly, the move shifts from continuation to fade risk.

Frequently Asked Questions

Why did ABSI stock jump today?

ABSI shares rose 23.1% following a new capital markets filing. This move is largely idiosyncratic and represents a shift in market sentiment toward the firm’s financial positioning.

Is Absci profitable?

No, Absci is a clinical-stage biotechnology company that is currently not profitable. It reported a trailing EPS of -$0.84 and a free cash flow of -$37.2 million.

📚 Related Articles

Data sources: Yahoo Finance · SEC EDGAR · Insider Monkey · Simply Wall St. · StockStory


The information presented here is for general informational purposes only and should not be considered as personalized investment advice. All investing involves risk.

📊 Data Sources
yfinance · FRED (St. Louis Fed) · SEC EDGAR · Finnhub · World Bank · Wikidata
Last Updated: 2026-04-28 05:18 KST
This analysis uses public data sources. Investment decisions are your own responsibility.
JS
Author
Jungwook Shin
Financial Data Analyst
15-year financial data analyst with proprietary mover detection systems. Real-time catalyst analysis across US, Korea, and Japan markets.

프로필 보기 →

Editorial & Policies

💼 Recommended Brokers

Charles Schwab
All-around US broker. Free commissions, banking integration, excellent research.

→ Charles Schwab

Interactive Brokers
Best for international + active traders. 150+ markets, lowest margin rates.

→ Interactive Brokers

Fidelity
Best for retirement. Free ZERO expense ratio funds.

→ Fidelity

Affiliate disclosure: We may receive compensation if you open an account through these links. This does not affect our analysis.

Leave a Comment

Your email address will not be published. Required fields are marked *

Scroll to Top
𝕏 ƒ in 🔗