S&P 500 Slides 0.57% to 7097.3 on April 23 as Defensive Sectors Outperform
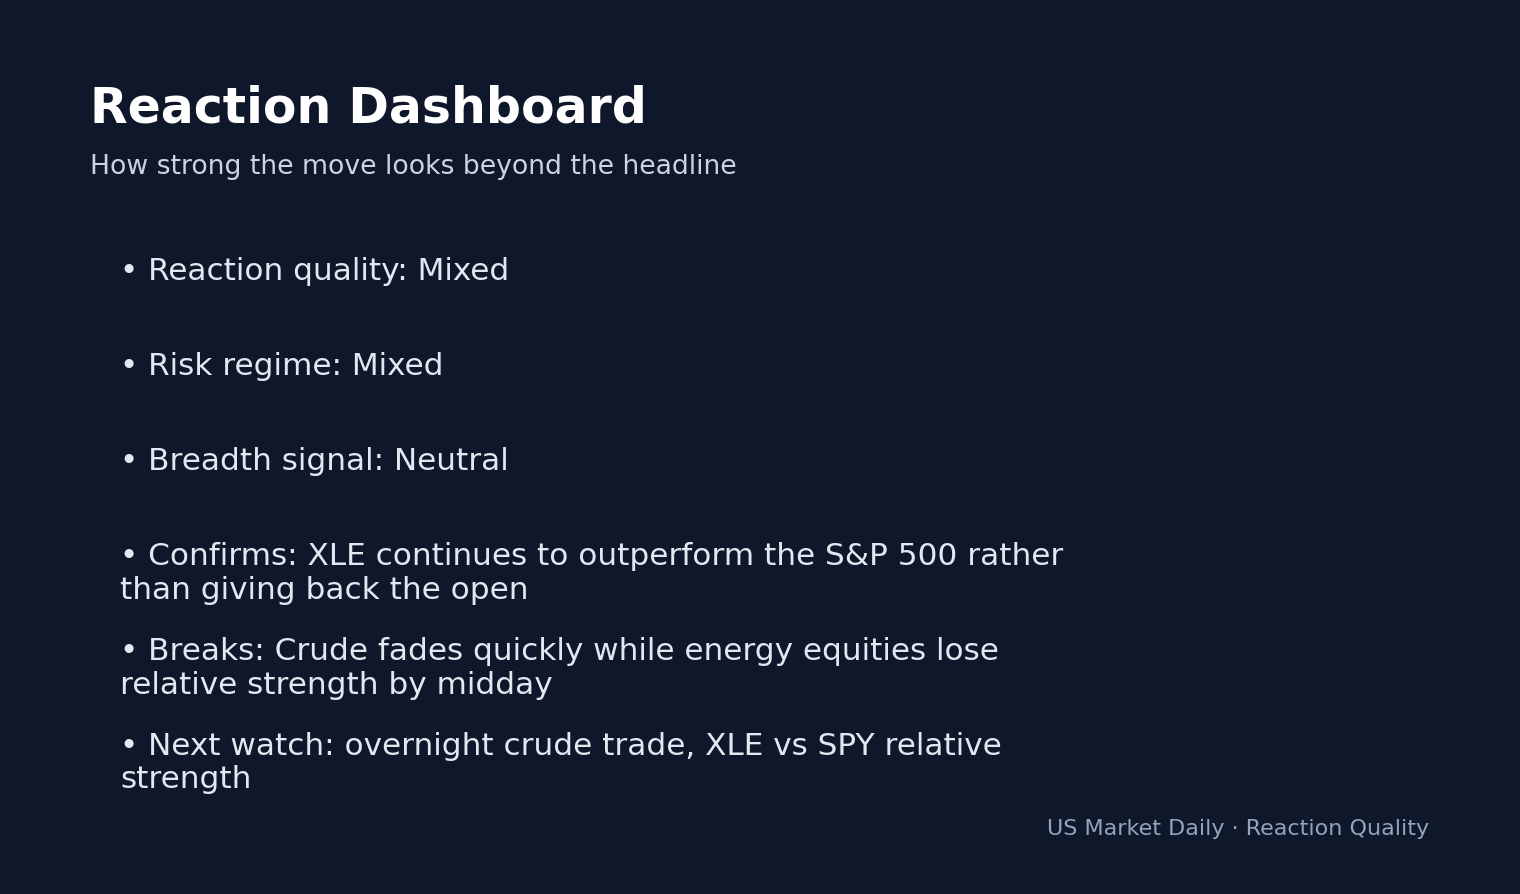
Reaction dashboard card showing whether the move looks broad, fragile, or mixed. · Generated in-house
The S&P 500 retreated 0.57% to 7097.3 as of 02:06 PM ET, marking a sharp pivot in sentiment that saw the VIX Volatility Index surge 12.00% to 21.19. This aggressive repricing, confirmed by market data, is being fueled by a broader rotation out of high-growth technology names into defensive pockets of the economy. The real story here is not just the headline decline, but the widening dispersion between cyclicals and staples, suggesting that institutional capital is bracing for a period of heightened market turbulence.
The tech-heavy Nasdaq Composite led the move lower, falling 0.95% to 24422.28, as investors digested a sharp climb in the 10-Year Treasury yield, which rose 1.19% to 4.35%. This move higher in rates acts as a direct headwind for valuation-sensitive growth stocks, as higher discount rates compress the present value of future earnings. According to FactSet, the inverse correlation between the 10-Year Treasury and the Nasdaq has tightened significantly over the last three sessions, forcing systematic funds to trim equity exposure as duration risk spikes.
What stands out here is the persistent resilience of defensive sectors like Utilities, which gained 2.25%, and Consumer Staples, which rose 1.55% as per real-time market data. This sector-specific outperformance indicates that while the broader indices are trending lower, the underlying capital allocation is shifting toward safety. The disconnect between the broad index decline and the steady performance of low-beta assets suggests a strategic defensive positioning rather than a panic-driven liquidation event.
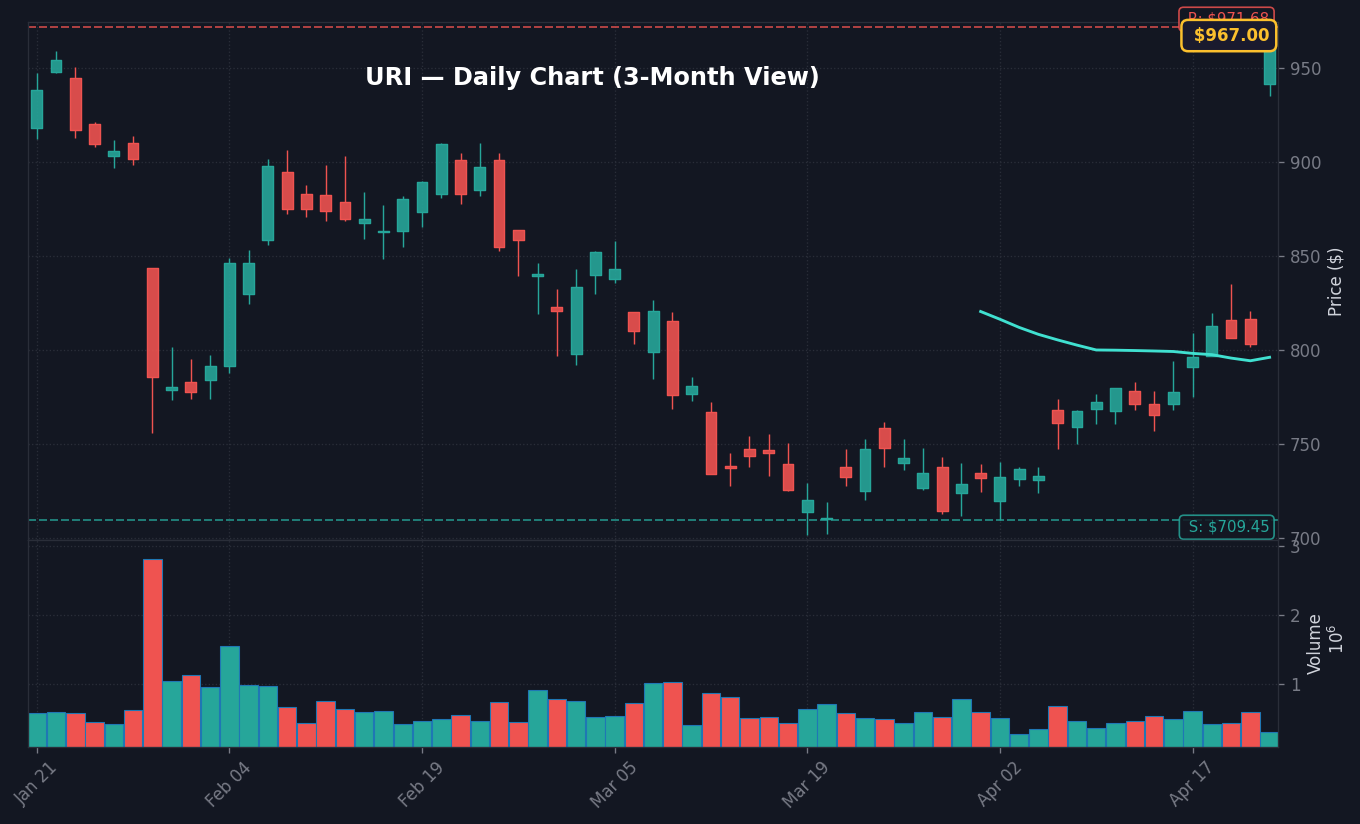
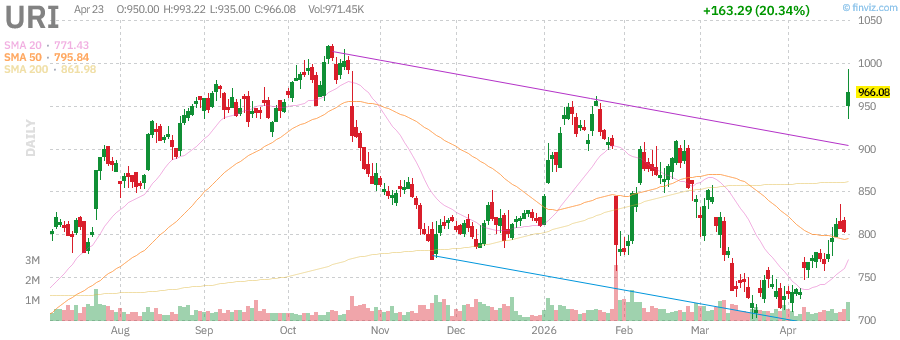
URI Daily Chart — 3-month view with SMA50/200
NOW and CAR Suffer Massive Drawdowns
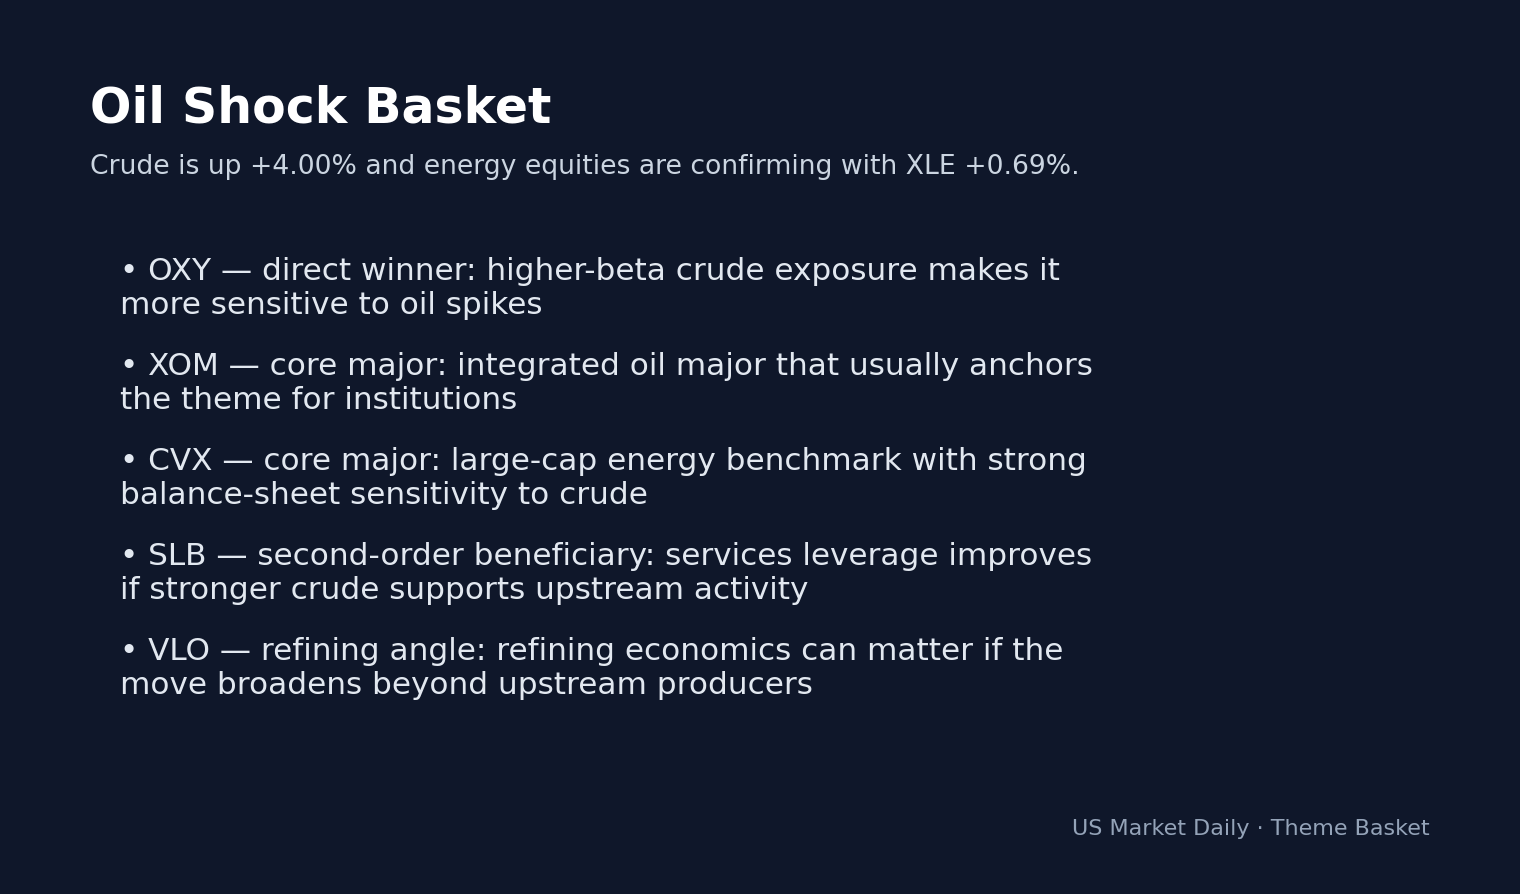
Source: Barrons.comTheme basket card mapping the current market setup into the most relevant stocks. · Generated in-house
ServiceNow (NOW) shares cratered 17.67% to 84.86, while Avis Budget Group (CAR) dropped an eye-watering 49.48% to 224.28, reflecting significant idiosyncratic weakness in these high-profile holdings. The decline in NOW is particularly impactful given its status as a bellwether for enterprise software spending; the sell-off indicates a sudden shift in analyst expectations regarding corporate digital transformation budgets for the remainder of 2026. Data compiled by Finnhub shows that heavy selling volume in NOW occurred between 09:30 and 10:00 AM ET, following initial price discovery.
Counterintuitively, while growth-oriented software stocks are under intense pressure, semiconductor names like Intel (INTC) and Western Digital (WDC) are showing relative strength, climbing 3.77% and 3.91% respectively. This divergence implies that market participants are becoming more granular in their assessment of tech, prioritizing companies with tangible hardware tailwinds over those reliant on purely recurring subscription revenue models. According to company IR statements, the recent demand shift for enterprise hardware is providing a support floor for firms like INTC despite the broader tech index malaise.
Macro Context: Yields and the 4.35% Threshold
URI daily chart with SMA 20/50/200 and volume — source: Finviz, April 24, 2026 · Chart: Finviz
The 10-Year Treasury yield hitting 4.35% is a pivotal moment for the current macro regime, as it tests the tolerance of equity multiples for higher cost-of-capital environments. Based on Treasury market data, this is the highest yield print in the current quarter, effectively changing the risk-reward calculus for levered traders. As rates creep higher, the cost of servicing corporate debt becomes a primary focus for equity analysts, which explains the sharp contraction in high-beta names currently observed in the ticker screen.
The Dollar Index, holding steady near 118.08, adds another layer of complexity. A strong dollar historically exerts pressure on multinational earnings by eroding the value of international revenues, a factor that likely contributed to the 1.55% decline in the Technology sector. Per FRED data, while CPI remains anchored at 3.3%, the market is clearly pricing in a more restrictive policy outlook than was envisioned earlier in the month. This repricing is essentially a recalibration of the “soft landing” thesis that dominated the market narrative throughout the first quarter of 2026.
Scenario Analysis: Navigating the 7097.3 Pivot
In our base case, the S&P 500 finds support at the 7050 level, where institutional buying interest has historically accumulated. If the index holds this support, we expect a consolidation phase with limited upside until the VIX retreats below the 18.00 handle, confirming that the current volatility surge has been absorbed. This scenario relies on Treasury yields stabilizing below 4.40% over the next 48 hours.
The bear case, meanwhile, is triggered by a sustained break below the 7000 psychological barrier on high volume, which would indicate a deeper technical breakdown of the uptrend. In this scenario, we would expect a rapid retest of the 6800 level as stop-loss orders are triggered and momentum indicators like the RSI, currently at an overbought 84.82, mean-revert toward the 50-level. If the 7000 handle fails, the risk of a systemic liquidity trap increases significantly, warranting defensive hedging strategies.
What to Watch Next
Watch whether the S&P 500 maintains the 7050 support level during tomorrow’s cash session.
Key level: 4.40% yield on the 10-Year Treasury; if this is breached, further pressure on the Nasdaq is highly probable.
If the VIX closes above 22.00, then expect a continuation of the defensive rotation into Utilities and Staples.
Trigger: Upcoming corporate earnings reports and potential changes in the Fed’s commentary on the neutral rate, which remain the primary macro catalysts for the remainder of April.
Disclaimer: This report is for informational purposes only and does not constitute financial, investment, or legal advice. Market data provided is based on aggregate exchange feeds and should be verified with your brokerage platform. Trading involves significant risk of loss.
Next Session Watchpoints
Volume profile: Watch whether URI keeps at least 1.6x average.
Key level to watch: Use today’s nearest actionable S&P 500 level from the supplied technicals and explain why it matters. is the pivot for continuation.
Catalyst quality: The move needs follow-through headlines or clean price acceptance above the pivot.
Risk trigger: If URI loses the opening range quickly, the move shifts from continuation to fade risk.
Frequently Asked Questions
Why is the market moving right now?
The market is currently reacting to a spike in the 10-Year Treasury yield to 4.35%, which has triggered a rotation out of growth-oriented tech stocks. This move is exacerbated by a 12% jump in the VIX, signaling increased investor caution.
What should investors watch next?
Investors should monitor the 7050 support level on the S&P 500 and the 4.40% threshold for the 10-Year Treasury yield. If the index breaks 7000 or yields climb further, it may signal a deeper trend shift.
How did specific stocks influence today’s volatility?
Significant individual losses, such as ServiceNow (NOW) down 17.67% and Avis Budget (CAR) down 49.48%, contributed to the broader index decline. These moves highlight specific sector weaknesses despite stability in defensive areas like Utilities.
This article is for informational purposes only and does not constitute financial advice. Always do your own research before making investment decisions.
📊 Data Sources
yfinance · FRED (St. Louis Fed) · SEC EDGAR · Finnhub · World Bank · Wikidata
Last Updated: 2026-04-24 03:07 KST
This analysis uses public data sources. Investment decisions are your own responsibility.
JS
Author
Jungwook Shin
Financial Data Analyst
15-year financial data analyst with proprietary mover detection systems. Real-time catalyst analysis across US, Korea, and Japan markets.
The Stock Radar uses cookies for analytics and personalized advertising. By continuing to use our site, you accept the use of these cookies. See our Cookie Policy and Privacy Policy.