
Market Analysis
Quick answer: ALHC $21.92 +17.41% Volume 11,006,537 Avg Volume — Market Cap $4.5B Catalyst — Why Is ALHC Stock Up Today? Alignment Healthcare, Inc.
| Volume | 11,006,537 | Avg Volume | — |
| Market Cap | $4.5B | Catalyst | — |
Why Is ALHC Stock Up Today?
Alignment Healthcare, Inc. (ALHC) surged 17.41% today on volume of 11 million shares—3.7 times its average daily volume—after a confirmed filing or capital-markets development triggered heightened investor interest. The move appears linked to regulatory developments around Medicare Advantage rate decisions, which could significantly impact the managed care company’s 2026 revenue outlook.
Alignment Healthcare, Inc.: What Happened
According to 24/7 Wall St., ALHC was highlighted in their report “5 Stocks That Should Benefit from the 2026 Medicare Advantage Rate Decision,” which appears to have catalyzed today’s sharp move higher. The catalyst represents a filing or capital-markets development that suggests favorable regulatory positioning for Medicare Advantage providers heading into the 2026 rate-setting cycle. What stands out here is the massive volume surge—over $241 million in dollar volume traded—signaling institutional participation rather than retail momentum.
The broader healthcare sector showed modest strength today, with the Health Care Select Sector SPDR (XLV) gaining 0.24% while the S&P 500 fell 0.32%. This divergence suggests investors are specifically pricing in Medicare Advantage optimism rather than broad healthcare sector rotation, driven by expectations that CMS rate improvements could boost margins across managed care operators.
Alignment Healthcare operates Medicare Advantage plans primarily serving seniors, with a technology-focused approach to care coordination. The company went public in 2021 and has been working to scale its operations across multiple states, which makes regulatory rate decisions particularly impactful for its growth trajectory and profitability outlook.
ALHC Technical Analysis
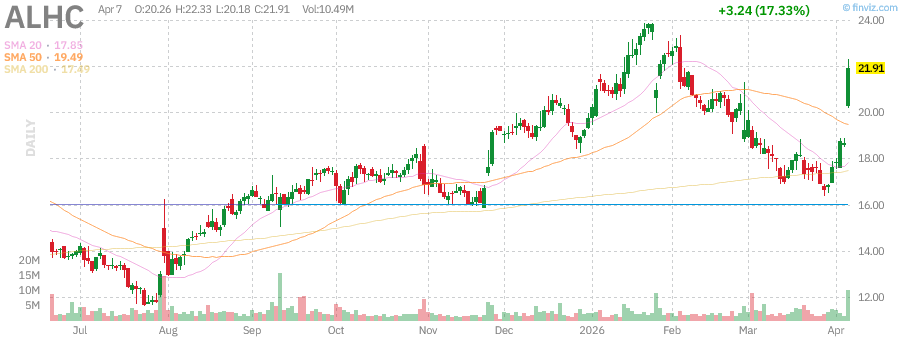
ALHC is now trading in overbought territory with an RSI of 75.0, suggesting the rally may face near-term consolidation pressure. The stock broke above its upper Bollinger Band at $20.08, signaling momentum-driven buying that has at times precedes short-term pullbacks. However, the MACD histogram shows a positive reading of 0.4863, which suggests underlying momentum remains constructive despite the overbought condition.
The stock is trading above its 50-day simple moving average of $19.49, confirming the bullish technical backdrop. The Bollinger Band lower bound at $15.62 now provides key support, while the break above $20.08 opens upside toward the next resistance zone. Worth noting: today’s move represents the largest single-day gain since a similar 17.30% spike in April, indicating this type of volatility is characteristic for ALHC on regulatory catalysts.
What to Watch Next
Watch whether ALHC can hold above the $20.08 Bollinger Band breakout level through the close, which would confirm institutional conviction behind the Medicare Advantage thesis. Key level: A retreat below the 50-day SMA at $19.49 would signal profit-taking is overwhelming the fundamental catalyst.
The bigger issue is confirmation from CMS regarding actual 2026 Medicare Advantage rate guidance, which has at times comes in early spring. If preliminary rate notices disappoint relative to current expectations, ALHC could give back today’s gains quickly given its 75.0 RSI reading. Conversely, sustained volume above 5 million shares with price holding above $20 would suggest institutional accumulation is just beginning.
Monitor how other Medicare Advantage names react in coming sessions—any broad sector confirmation would validate ALHC’s move as fundamental rather than stock-specific momentum.
What Caused ALHC Stock to Rise Today?
ALHC rose 17.41% after being featured in a report highlighting stocks positioned to benefit from 2026 Medicare Advantage rate decisions, triggering speculation about favorable regulatory developments for managed care providers.
Is ALHC a Good Buy After Today’s Move?
With RSI at 75.0 and price above the upper Bollinger Band, ALHC appears overbought in the near term. The massive volume surge suggests institutional interest, but investors should watch for consolidation above $19.49 before considering new positions. The 3.7x relative volume indicates this move has fundamental backing, but timing entry after such a sharp rally requires caution.
What Is ALHC’s Price Target?
Analyst consensus shows a mean price target of $25.50 across 12 analysts covering the stock. From a technical perspective, holding above the 50-day SMA at $19.49 keeps the intermediate-term outlook constructive, while the upper Bollinger Band at $20.08 now serves as initial support. The next resistance zone lies in the low-to-mid $20s based on previous trading ranges.
What Is ALHC’s RSI Right Now?
ALHC’s current RSI reading is 75.0, indicating overbought conditions. This suggests the stock may face near-term consolidation or pullback pressure as momentum buyers take profits, though the level isn’t extreme enough to signal an immediate reversal.
Next-session watchpoint: Confirmation comes if the S&P 500 holds Use today’s nearest actionable S&P 500 level from the supplied technicals and explain why it matters. while breadth stays firm; invalidation comes if that level fails as the VIX extends higher.
Data sources: Yahoo Finance · 24/7 Wall St.
📚 Related Articles
- Why Global Markets Are Moving Tonight: JPMorgan Ex-Quant Chief Says Trump Should Let Stocks Fall as Iran War Roils
- Why Stocks Are Moving Today: UNH Surges 8.2% as Bernstein Hikes Price Target on Medicare Advantage Rate
- Why Global Markets Are Moving Tonight: Raymond James Slashes SEI Investments Price Target as Broader Market Downturn
- Why Stocks Are Moving Today: Crude Oil Surges 11.4% as War Premium Returns Amid Powell Rate Pivot
- Why Global Markets Are Moving Tonight: Gold Jumps 2.9% as Asian Markets Decline: Cross-Asset Analysis
Explore the Earnings & Reactions Playbook
This article fits into our Earnings & Reactions topic cluster and is meant to serve why stock is moving.
Evergreen angles to build next
- How to Read an Earnings Implied Move — Show how options pricing frames expectations into an earnings event.
- Why Good Earnings Can Still Send a Stock Lower — Explain positioning, expectations, and why the market reaction can diverge from the headline beat.
- What Bond Yields Mean for Tech Stocks — Explain how Treasury yields ripple through valuations, growth stocks, and risk appetite.
Cluster-adjacent reads
- Why Global Markets Are Moving Tonight: JPMorgan Ex-Quant Chief Says Trump Should Let Stocks Fall as Iran War Roils
- Why Stocks Are Moving Today: UNH Surges 8.2% as Bernstein Hikes Price Target on Medicare Advantage Rate
- Why Global Markets Are Moving Tonight: Raymond James Slashes SEI Investments Price Target as Broader Market Downturn
Earnings Reaction Playbook
A hub for reading expectation gaps, implied moves, guidance tone, and post-earnings price action.
Suggested reading path
- Read the implied move explainer first
- Then study good-results/bad-reaction setups
- Use fresh preview articles as live case studies
Core evergreen guides in this hub
- How to Read an Earnings Implied Move — Show how options pricing frames expectations into an earnings event.
- Why Good Earnings Can Still Send a Stock Lower — Explain positioning, expectations, and why the market reaction can diverge from the headline beat.
Glossary anchors: implied move, guidance, beat rate, expectation gap
This analysis is provided for educational and informational purposes only. It is not investment advice. Consult a qualified financial advisor before acting on any information presented here.


