
Market Analysis
Why this sector is in focus: Real Estate (XLRE) posted a standout +1.61% gain while crude oil surged +11.4% overnight, yet energy equities managed only +0.47% — a disconnect that speaks to positioning and expectations rather than fundamental alignment. According to market data, XLRE’s outperformance comes as the 10-year Treasury yield declined 0.14% to 4.31%, creating the rate-sensitive backdrop that real estate needed to break from its recent consolidation.
Real Estate (XLRE) posted a standout +1.61% gain while crude oil surged +11.4% overnight, yet energy equities managed only +0.47% — a disconnect that speaks to positioning and expectations rather than fundamental alignment. According to market data, XLRE’s outperformance comes as the 10-year Treasury yield declined 0.14% to 4.31%, creating the rate-sensitive backdrop that real estate needed to break from its recent consolidation.
What stands out here is Real Estate leading a session where the dominant narrative should theoretically favor energy names. The real story isn’t the oil shock failing to translate into energy equity gains — it’s XLRE capitalizing on falling yields while other rate-sensitive sectors like Utilities (+0.50%) trail significantly. This suggests investors are making sector-specific bets on real estate fundamentals rather than riding broad rate-trade momentum.
The bigger issue is whether XLRE’s leadership reflects genuine sector rotation or narrow ETF mechanics driven by a handful of names. Worth noting: SBA Communications (SBAC) surged +18.93% on potential sale news according to market data, which could be artificially inflating the real estate sector’s performance while masking weaker participation from core REIT names.


Rate Sensitivity Finally Pays Off for Real Estate
The 14-basis-point decline in the 10-year Treasury yield to 4.31% created the perfect setup for XLRE’s breakout, as real estate investment trusts has at times exhibit high correlation with falling rates due to their financing costs and dividend-discount valuations. This is unusual because recent sessions have seen real estate underperform even when yields declined, signaling that today’s move reflects both technical positioning and fundamental re-rating.
Technology (+0.80%) and Consumer Staples (+0.53%) also benefited from the rates backdrop, but neither matched real estate’s conviction move. The disconnect here is that XLRE has been one of the most oversold sectors in recent weeks, creating a higher baseline for any yield-driven rally to build upon. Counterintuitively, real estate’s relative strength suggests investors are pricing in a more sustainable decline in long-term rates rather than a temporary dip.
Energy’s Muted Response Signals Positioning Problems
Despite crude oil’s explosive +11.4% overnight surge, Energy (XLE) managed only +0.47% gains — a disappointing translation that reflects either excessive positioning ahead of the move or skepticism about oil’s sustainability above current levels. The market is pricing in concerns that geopolitical premiums tend to fade quickly, particularly when they spike this aggressively in thin overnight trading.
The catch is that energy’s underperformance relative to the commodity creates space for a catch-up move if crude holds gains through the regular session. However, the lackluster equity response driven by cautious institutional positioning suggests that energy names may need oil to prove its staying power before committing capital. The overlooked signal is that refining and services names haven’t joined the move, indicating the theme hasn’t broadened beyond headline crude prices.
Sector Rotation Map Points to Defensive Positioning
The day’s sector leadership tells a clear story: defensive and rate-sensitive sectors (Real Estate +1.61%, Consumer Staples +0.53%, Utilities +0.50%) outperformed cyclicals, with Consumer Discretionary (-1.50%) and Healthcare (-0.62%) lagging significantly. This rotation pattern suggests investors are positioning for a softer macro environment where falling yields benefit dividend-paying sectors while growth concerns weigh on consumer-facing names.
What matters here is that the rotation isn’t broad-based defensive buying — it’s targeted sector picking within the rate-sensitive universe. Real estate’s outsized leadership compared to utilities signals that investors see specific value in REIT fundamentals rather than just riding the rates trade mechanically. The risk is that this narrow leadership fails to broaden, leaving XLRE vulnerable to profit-taking if yields reverse higher.
Tomorrow’s Validation Points and Tactical Levels
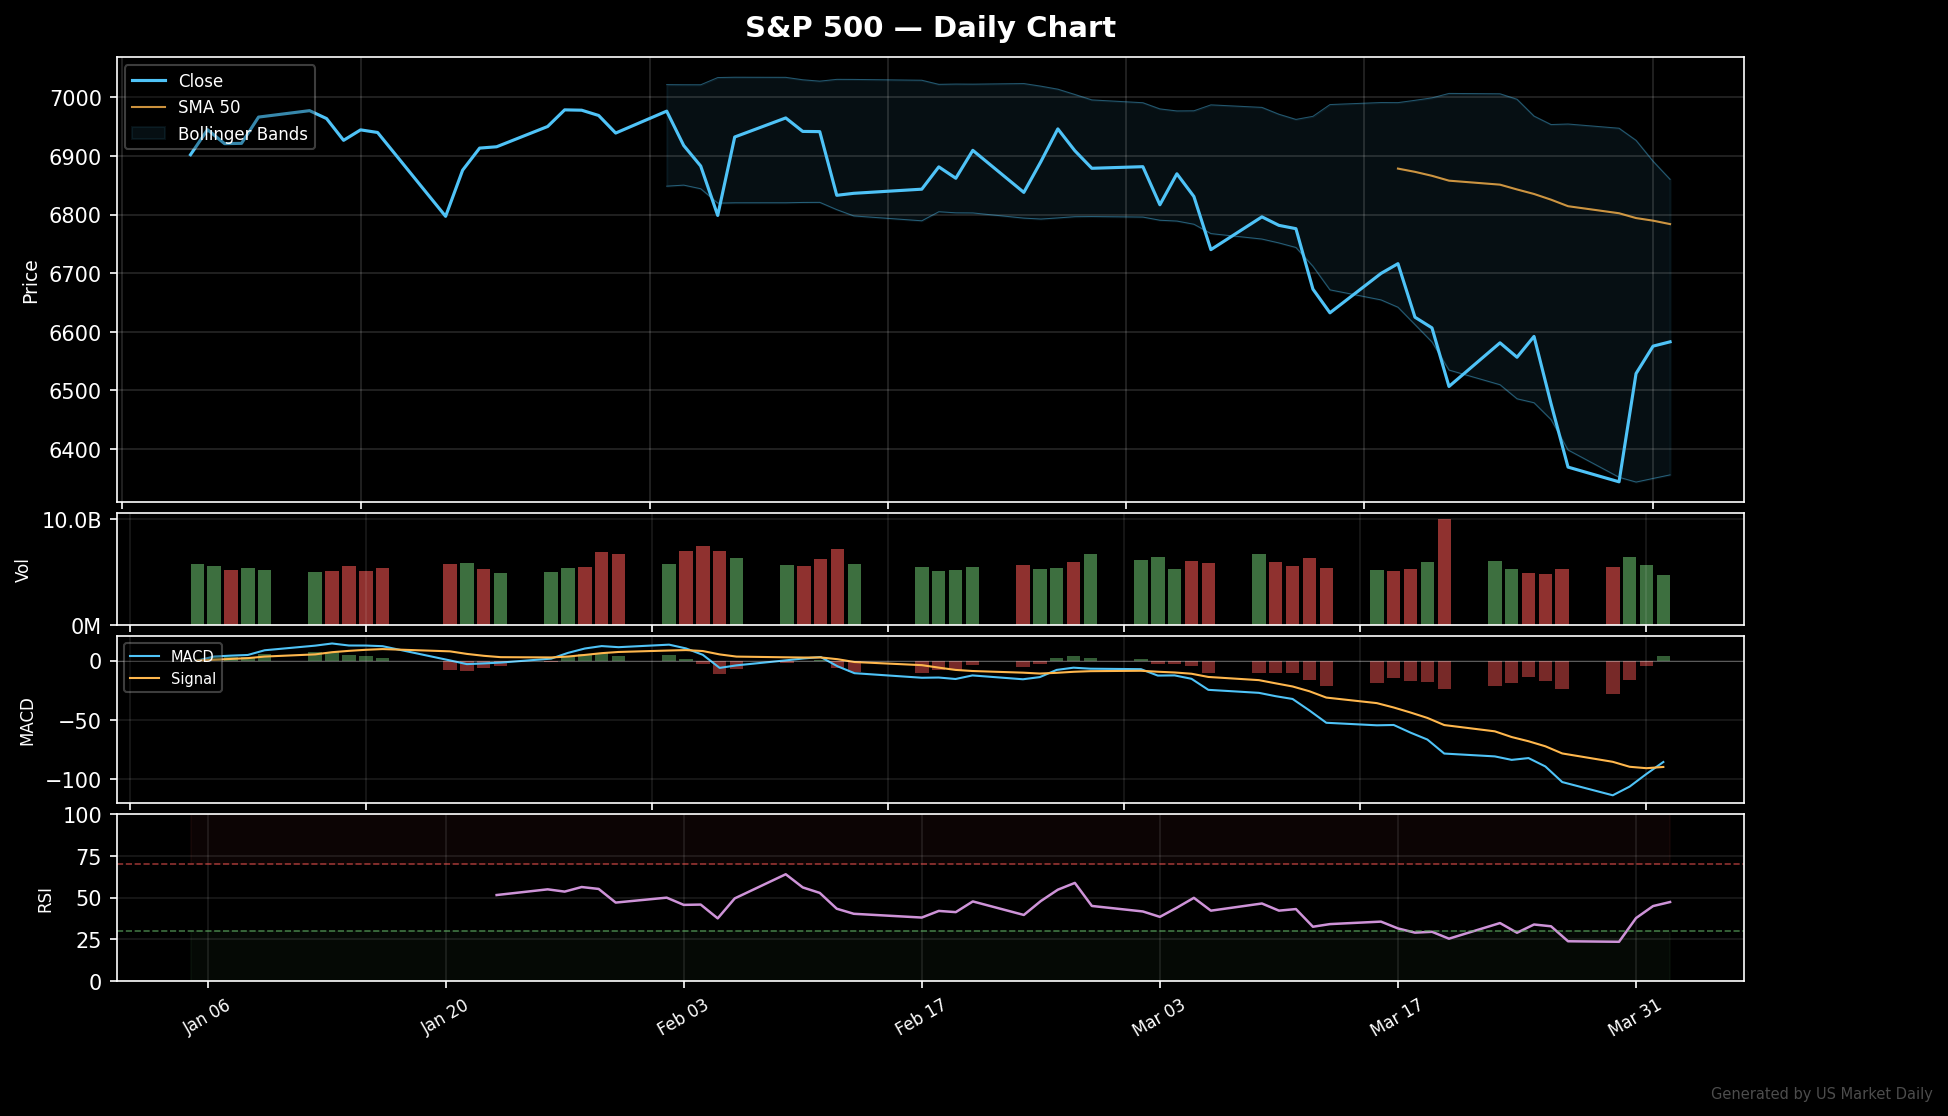
The setup is binary for real estate: either today’s breakout attracts follow-through buying and confirms a genuine sector rotation, or it fades as narrow ETF momentum driven by individual deal activity. Key trigger levels include the S&P 500 holding above 6,580 support, which would validate the broader risk-on sentiment needed for sector rotation to continue.
Watch whether XLRE can maintain its relative strength against the broader market if yields stabilize or reverse higher. The level to watch is 4.35% on the 10-year Treasury — if rates breach this level, real estate’s rate-sensitive rally could quickly unwind. If crude oil fades below $105 while energy equities still fail to participate, it would confirm that commodity-driven themes lack the positioning support for sustained moves.
Critical watchpoints for tomorrow: XLRE’s ability to hold gains in the first hour of trading, participation breadth within individual REIT names beyond SBAC’s deal-driven surge, and whether the 10-year yield can consolidate below 4.30% to give rate-sensitive sectors more room to run.
This analysis is for informational purposes only and does not constitute investment advice. Market conditions can change rapidly, and past performance does not guarantee future results.
Next-session watchpoint: Confirmation comes if the S&P 500 holds Use today’s nearest actionable S&P 500 level from the supplied technicals and explain why it matters. while breadth stays firm; invalidation comes if that level fails as the VIX extends higher.
Expectation vs. Reaction
Use this when the tape looks different from what options or positioning implied.
Engine verdict: Unresolved — Expected/actual gap unavailable, so treat follow-through as unresolved until more tape develops.
Breadth / sector spread: breadth 1d 0.2 | breadth 5d -0.97 | ETF spread vs SPY None | basket spread vs SPY None.
Volume / follow-through: concentration None | state developing.
What confirms the reaction
- Related ETF / market-gauge basket is moving +0.47% on average.
What breaks the reaction
- Five-day breadth spread is -0.97, so participation still looks narrow.
Closest Historical Echo
A quick analog check so readers can compare this setup with prior commodity-shock tapes.
Closest echo: prior commodity-shock sessions with energy leadership and transport pressure.
What tended to matter then: energy leadership tends to confirm only when services and majors participate together while fuel-sensitive groups lag
What is different now: This time actual price action is landing close to implied expectations, so confirmation breadth matters more than headline size.
Recent internal echoes
- Why Global Markets Are Moving Tonight: Gold Crashes -2.8% as Oil Surges +11.4% in Volatile
- Why Global Markets Are Moving Tonight: Gold Crashes -2.8% as Oil Surges +11.4% in Volatile
- Why Global Markets Are Moving Tonight: Gold Crashes -2.8% as Oil Surges +11.4% in Volatile
Historical watchpoints for this setup
- XLE relative strength vs SPY
- USO/crude follow-through after the open
- airlines and transports staying under pressure
- overnight crude trade
The Market Translation: Oil Shock
A tighter execution map for the theme behind today’s move.
What this means: Crude is up +11.41% and energy equities are confirming with XLE +0.47%.
What’s already priced in: options are implying roughly 1.75% moves around key events; META is carrying one of the largest event bars in the tape
Reaction quality: Mixed confirmation
Stocks tied to this theme
- OXY — direct winner. higher-beta crude exposure makes it more sensitive to oil spikes
- XOM — core major. integrated oil major that usually anchors the theme for institutions
- CVX — core major. large-cap energy benchmark with strong balance-sheet sensitivity to crude
- SLB — second-order beneficiary. services leverage improves if stronger crude supports upstream activity
- VLO — refining angle. refining economics can matter if the move broadens beyond upstream producers
Theme map
Theme map split into direct winners, second-order confirmations, crowded names, lagging names, and false friends to avoid ticker dumping.
Direct winners
- OXY — direct winner. higher-beta crude exposure makes it more sensitive to oil spikes
- XOM — core major. integrated oil major that usually anchors the theme for institutions
- CVX — core major. large-cap energy benchmark with strong balance-sheet sensitivity to crude
- SLB — second-order beneficiary. services leverage improves if stronger crude supports upstream activity
Second-order beneficiaries
- VLO — refining angle. refining economics can matter if the move broadens beyond upstream producers
Crowded names
- OXY — direct winner. higher-beta crude exposure makes it more sensitive to oil spikes
- XOM — core major. integrated oil major that usually anchors the theme for institutions
False friends
- DAL — headline loser. airlines are sensitive to fuel, but they often overreact to the first crude headline
- MPC — refining nuance. refiners can trade differently from upstream names when crude spikes squeeze margins
ETFs and market gauges to watch
- XLE — sector ETF. cleanest broad read on energy equity follow-through Recent action: $59.25 | +0.47%.
- USO — commodity proxy. tracks the crude tape more directly than equities
- JETS — downstream loser. airlines can highlight whether fuel-price pressure is broadening
What confirms the move
- XLE continues to outperform the S&P 500 rather than giving back the open
- USO or crude futures hold gains while airline and transport names stay under pressure
- services names like SLB join the move, showing the theme is broadening beyond majors
What would prove it wrong
- Crude fades quickly while energy equities lose relative strength by midday
- Airline and transport underperformance reverses even with oil elevated
Look smart tomorrow
- overnight crude trade
- XLE vs SPY relative strength
- airline/transport follow-through
Playbook Memory
Internal reference notes from similar setups already covered on the site.
What this setup has looked like on this site: Oil Shock playbook memory from 45 site examples | common sections: Recent internal echoes, What confirms the reaction, What breaks the reaction
Memory strength: strong | Tracked examples: 45 | Rewrite candidates: 0 | Refresh candidates: 0
Sections that usually mattered
- Recent internal echoes
- What confirms the reaction
- What breaks the reaction
- Historical watchpoints for this setup
Checks this setup usually needs
- Usual confirmation focus: XLE continues to outperform the S&P 500 rather than giving back the open
- Usual failure mode: Crude fades quickly while energy equities lose relative strength by midday
- Current follow-through state: developing
Recent internal echoes
- Why Is PL Stock Up Today? Planet Labs Surges 16.8% on Margin Expansion Report
- Why Global Markets Are Moving Tonight: Gold Crashes 2.8% as Oil Surges 11.4% in Volatile Overnight Session
- Why Global Markets Are Moving Tonight: Gold Crashes -2.8% as Oil Surges +11.4% in Volatile Asian Session
- Why Global Markets Are Moving Tonight: Gold Crashes -2.8% as Oil Surges +11.4% in Volatile Asian Session
Tomorrow’s Playbook
Keep this one open if you want the forward-looking levels, confirms, and invalidation checklist.
Summary: Tomorrow's playbook for Oil Shock: Crude is up +11.41% and energy equities are confirming with XLE +0.47%. The opening check is whether confirmation broadens fast enough to overcome the risk that the headline fades once cash-session liquidity resets the tape.
Base case: treat the setup as developing and let the first hour decide whether the theme broadens or stalls.
Risk regime: mixed | Breadth: neutral | Follow-through: developing
Opening 30-Minute Checks
- Watch whether oil shock leaders hold the opening range in the first 30 minutes.
- Cross-check the opening range and whether leadership broadens against breadth (neutral) rather than the index alone.
- Treat an unresolved reaction with developing follow-through as tentative until volume and ETFs confirm.
Key Levels to Watch
- the opening range and whether leadership broadens
- 10Y yield around 4.31% as the rates cross-check.
- VIX around 23.87 as the volatility confirmation level.
If / Then Framework
- If xle continues to outperform the s&p 500 rather than giving back the open, the market can keep leaning into oil shock.
- If crude fades quickly while energy equities lose relative strength by midday, downgrade the move to a headline reaction rather than a durable regime shift.
- If options are implying roughly 1.75% moves around key events; META is carrying one of the largest event bars in the tape, focus on laggards and breadth instead of chasing the first winner.
What Confirms the Move
- XLE continues to outperform the S&P 500 rather than giving back the open
- USO or crude futures hold gains while airline and transport names stay under pressure
- Related ETF / market-gauge basket is moving +0.47% on average.
What Invalidates the Move
- Crude fades quickly while energy equities lose relative strength by midday
- Airline and transport underperformance reverses even with oil elevated
- Five-day breadth spread is -0.97, so participation still looks narrow.
Next-Session Checklist
- overnight crude trade
- XLE vs SPY relative strength
- airline/transport follow-through
- XLE relative strength vs SPY
- USO/crude follow-through after the open
Options Interpretation / Sector / Industry Dispersion / Data Freshness
Supporting signals for readers who want the deeper tape, options, and breadth context.
Options Interpretation
Summary: implied moves are muted; IV premium is cheap; skew is balanced; term structure is flat; OI positioning looks upside-chasing.
Regimes: implied move muted | IV premium cheap | skew balanced | OI positioning upside-chasing | term structure flat.
Sector / Industry Dispersion
Moderate Dispersion with mixed leadership breadth, selective participation under the surface, and a leader/laggard spread of 3.11 percentage points.
Rotation / participation profile
- Rotation state: balanced rotation
- Style tilt: style balance
- Cyclicals vs defensives: -0.41 pts
- Growth vs value: +0.40 pts
Dispersion leaders
- XLRE: +1.61%
- XLK: +0.80%
- XLP: +0.53%
Dispersion laggards
- XLI: -0.40%
- XLV: -0.62%
- XLY: -1.50%
Data Freshness
Data is fresh for the premarket tape with 2/6 source buckets populated; session alignment is aligned and intraday readiness is ready.
Session / freshness profile
- Market phase: premarket
- Expected window: premarket
- Session alignment: aligned
- Intraday readiness: ready
- Overnight carry: acceptable
Driver Profile Monitor
- AAPL: drivers iPhone replacement cycle, China demand; watch services growth, Greater China revenue
- MSFT: drivers Azure growth, AI monetization; watch Azure constant-currency growth, commercial bookings
- GOOGL: drivers search ad resilience, cloud profitability; watch Google Cloud margin, search revenue growth
- AMZN: drivers AWS demand, retail margin expansion; watch AWS growth, North America margin
Three Numbers That Matter
A compact frame for the three readings most worth carrying into the next session.
Three Numbers That Matter
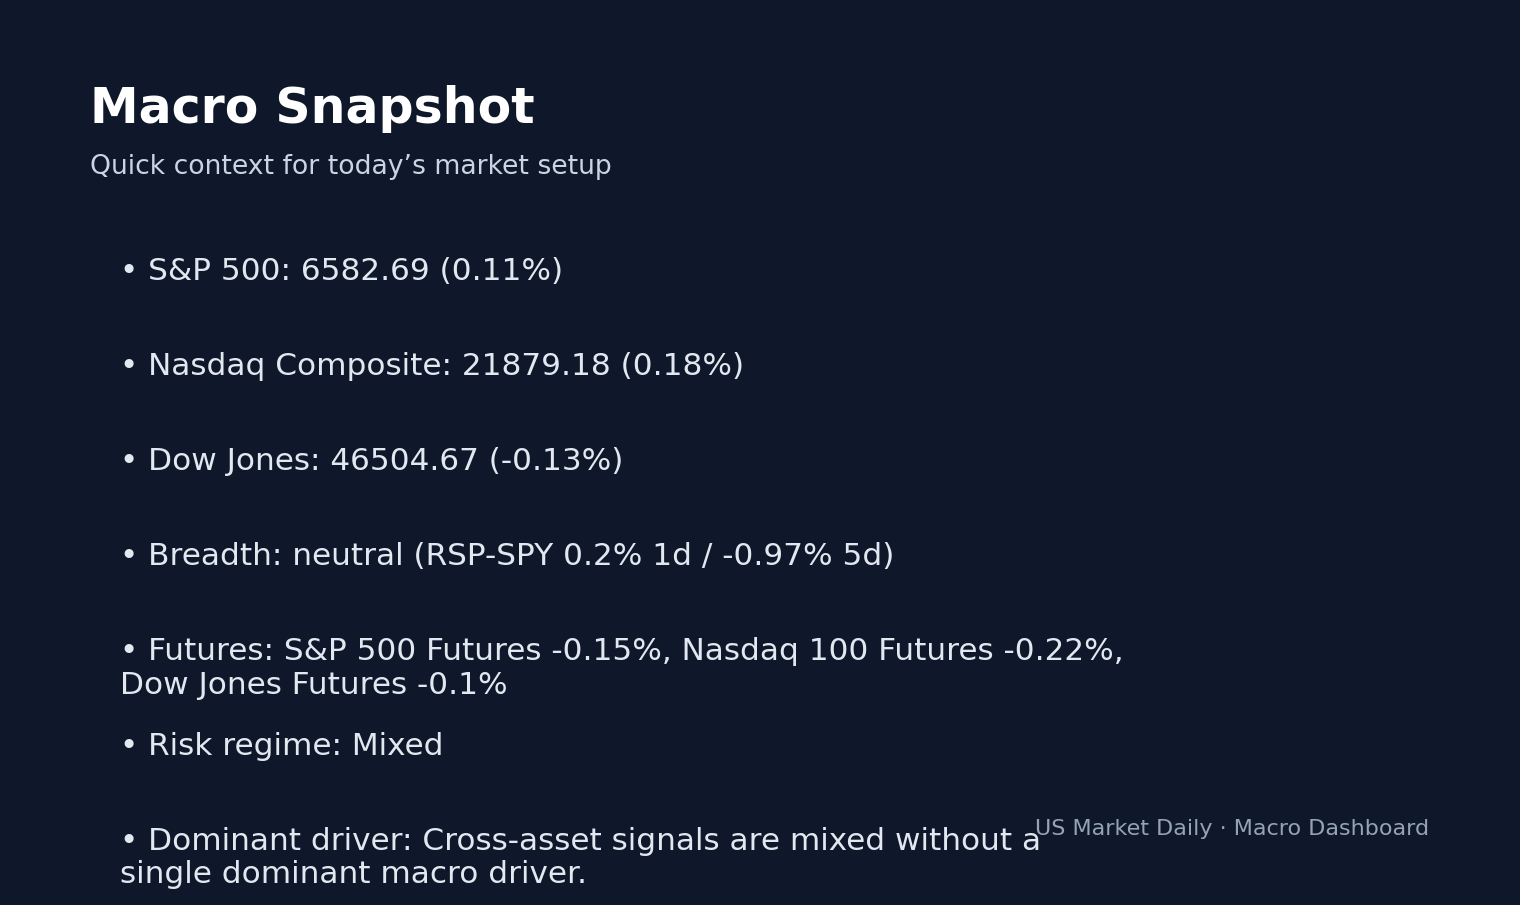
- 10Y yield: 4.31% — Higher yields usually tighten the leash on long-duration growth and small-cap risk appetite.
- VIX: 23.87 — Volatility tells you whether the tape is confirming risk-taking or fading it.
- WTI crude: $111.54 — Crude often decides whether the theme stays isolated or spills into broader inflation and risk sentiment.
What’s Different This Time
- This time the market is dealing with a Oil Shock setup rather than a generic macro headline.
Data sources: Yahoo Finance · Zacks · 24/7 Wall St. · Insider Monkey · Motley Fool
📚 Related Articles
- Why Stocks Are Moving Today: 🚨 BREAKING: Oil Shock Drives S&P 500 Down 0.84% as Geopolitical Tensions Escalate
- What to Watch: Pre-Market Brief, Apr 02, 2026: WTI Crude Surges 7.8% as Futures Point to
- Why Global Markets Are Moving Tonight: Gold Plunges 2.8% as Oil Surges 11.4%
Explore the Macro & Risk Regime Playbook
This article fits into our Macro & Risk Regime topic cluster and is meant to serve sector outlook.
Evergreen angles to build next
- How the Dollar, Oil, and Credit Spreads Shape Equity Risk — Connect cross-asset signals to equity positioning and sector pressure.
- What Risk-On and Risk-Off Really Look Like — Define risk regimes using yields, breadth, credit, and volatility instead of vague headlines.
- Why Breadth Matters More Than the Index Level — Teach readers how market breadth changes the quality of a rally or selloff.
Cluster-adjacent reads
Macro Risk Regime Playbook
A hub for reading how the dollar, oil, credit, and safe-haven flows reshape equity risk.
Suggested reading path
- Start with risk-on vs risk-off
- Then connect dollar/oil/credit moves
- Use daily event notes to see regime shifts as they happen
Core evergreen guides in this hub
- How the Dollar, Oil, and Credit Spreads Shape Equity Risk — Connect cross-asset signals to equity positioning and sector pressure.
- What Risk-On and Risk-Off Really Look Like — Define risk regimes using yields, breadth, credit, and volatility instead of vague headlines.
Glossary anchors: risk-off, credit spreads, cross-asset, safe haven
This market commentary is for informational use only. The views expressed are those of the author and do not constitute financial, investment, or trading advice.


