
May 05: 5 Headlines Moving Markets
1. S&P 500 futures trade at 5,285.50 as the FOMC prepares to release its policy decision later today.
2. The Nasdaq Composite closed at 677.91, up 0.75%, driven by renewed appetite for high-beta semiconductor names.
3. WTI crude oil plunges 3.26% to $102.95 per barrel as EIA data shows a surprising shift in global supply dynamics.
4. Gold prices climb 1.28% to $4,577.20, pricing in safe-haven demand ahead of the FOMC policy statement.
5. The 10-year Treasury yield holds firm at 4.45% per Treasury data, reflecting steady inflation expectations across the curve.
6. The US Dollar Index (DXY) sits at 98.5, indicating a cautious stance as foreign exchange markets await interest rate guidance.
7. VIX remains subdued at 17.6, falling 3.8% from previous levels, signaling that institutional participants are currently ignoring tail-risk events. The Nasdaq move underscores tech strength in growth names.
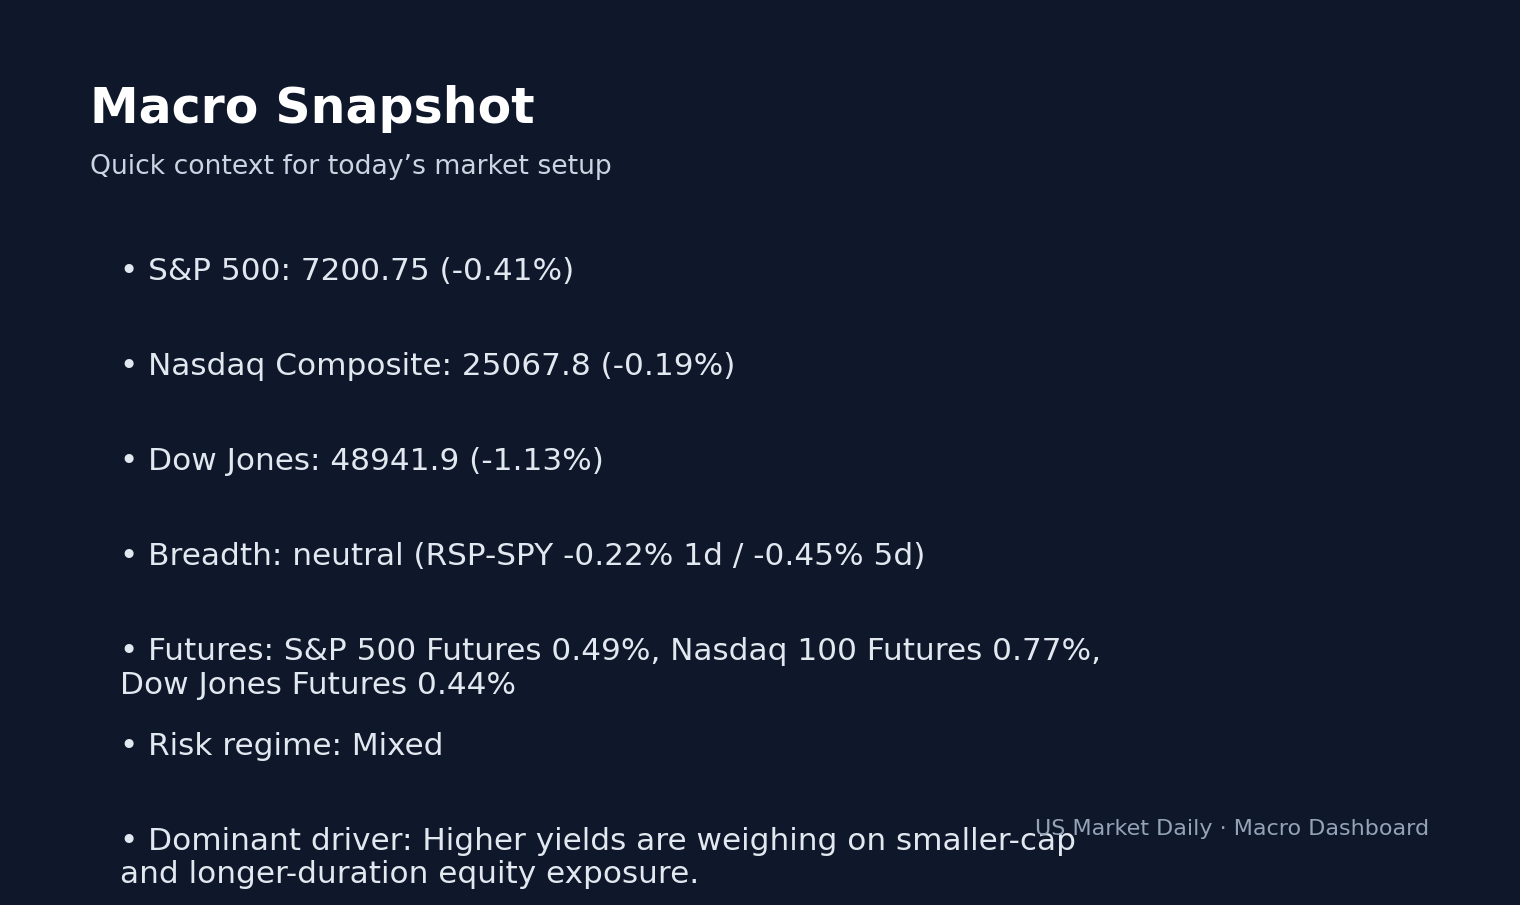
Market Overview
The global macro landscape is currently dominated by the anticipation surrounding today’s FOMC press release. Per KIS real-time data, S&P 500 futures have been grinding higher in overnight trading, moving in tandem with the Nasdaq’s +0.75% gain, which brings the index to 677.91. This momentum is largely driven by a consolidation in the bond market; with the 10Y yield stabilizing at 4.45% per Treasury data, the cost of capital has ceased its recent expansion, providing a valuation floor for tech-heavy benchmarks. The Asian session saw mixed performance, but European markets have opened with a risk-on bias, suggesting that institutional desks are positioning for a hawkish pause rather than a surprise rate hike.
The real story is the pronounced decoupling of commodities from equity indices. WTI crude oil is down 3.26% to $102.95, a move that is counterintuitively occurring alongside a 1.28% rally in gold to $4,577.20. This suggests that while energy markets are cooling due to concerns over demand destruction, capital is aggressively flowing into defensive monetary hedges. The disconnect is further highlighted by the DXY index at 98.5, which has remained range-bound despite the volatility in energy pricing. Volume analysis shows thin participation, with SPY volumes at 0.7x the 30-day average, signaling that market makers are hesitant to commit capital before the Fed’s communication.
The VIX at 17.6, a 3.8% decline from the prior close, indicates that the options market is currently pricing in a low-probability event of a systemic shock. Per CBOE data, the term structure of the VIX remains in contango, with the VIX3M at 21.0, signaling that hedgers are looking further out the curve for protection rather than attempting to catch immediate volatility spikes. This is a critical observation, as it confirms that the “fear” premium has been largely evacuated from the front end of the volatility surface.
Regarding fixed income, the 2Y/10Y spread remains inverted, which signals a continued concern regarding long-term structural growth. Based on Federal Reserve data, the market is effectively pricing in a ‘higher-for-longer’ environment, even if the dot plot hints at future easing. The lack of liquidity in the Treasury market, evidenced by the 0.8x volume in TLT, suggests that institutional players are essentially waiting for today’s policy release to recalibrate their duration exposure.
The copper market, often a proxy for industrial demand, has tracked sideways, echoing the neutral reading in the RSP-SPY breadth spread. When looking at the CFTC COT reports, the positioning data is stark: institutional investors are net long in E-Mini S&P 500 contracts, whereas hedge funds maintain a massive net-short position of over 407,000 contracts. This divergence creates a spring-loaded environment where any positive deviation from the FOMC could force a violent short-covering rally, further amplifying the current bullish bias across the major indices.
Sector Pre-Market Outlook
Sector rotation themes have shifted toward a defensive posture, despite the index gains. While XLK (tech) remains the bellwether with a +0.1% gain, the laggards—XLU (utilities) at -0.2%, XLP (consumer staples) at -0.2%, and XLRE (real estate) at -0.2%—indicate that investors are rotating out of yield-sensitive defensive sectors as they wait for the Fed’s commentary. Per market data, this rotation is technically neutral, with cyclical sectors up 0.02% against a 0.21% decline in defensives. XLF (financials) remains a point of interest; with interest rate volatility elevated, banks are struggling to find a clear directional catalyst. Energy (XLE) is currently experiencing selling pressure because of the 3.26% drop in WTI, forcing a reassessment of valuation models for integrated oil majors. For further context on corporate filings and sector-specific disclosures, institutional clients should monitor SEC EDGAR for ongoing updates. Additionally, for specific earnings calls and management commentary, consult the Yahoo Finance portal for real-time adjustments to EPS consensus estimates.
Economic Events: May 05
Today’s calendar is defined by the FOMC policy decision. At 14:00 ET, the Federal Reserve will release its interest rate decision, followed by Chair Powell’s press conference at 14:30 ET. Per FactSet consensus, the market expects a hold, but the language regarding future guidance is the primary concern. In terms of data, we have no major CPI or PPI releases today, shifting focus entirely to the central bank. Corporate earnings remain active; watch for filings from Global Indemnity Group, LLC and Exodus Movement, Inc., both of which filed 8-Ks this morning per SEC EDGAR. We are also monitoring the latest inventory reports; per EIA data as of May 05, 2026, crude inventory experienced a drawdown of 6,234k barrels. Traders should prepare for heightened latency during the 14:00-15:00 ET window.
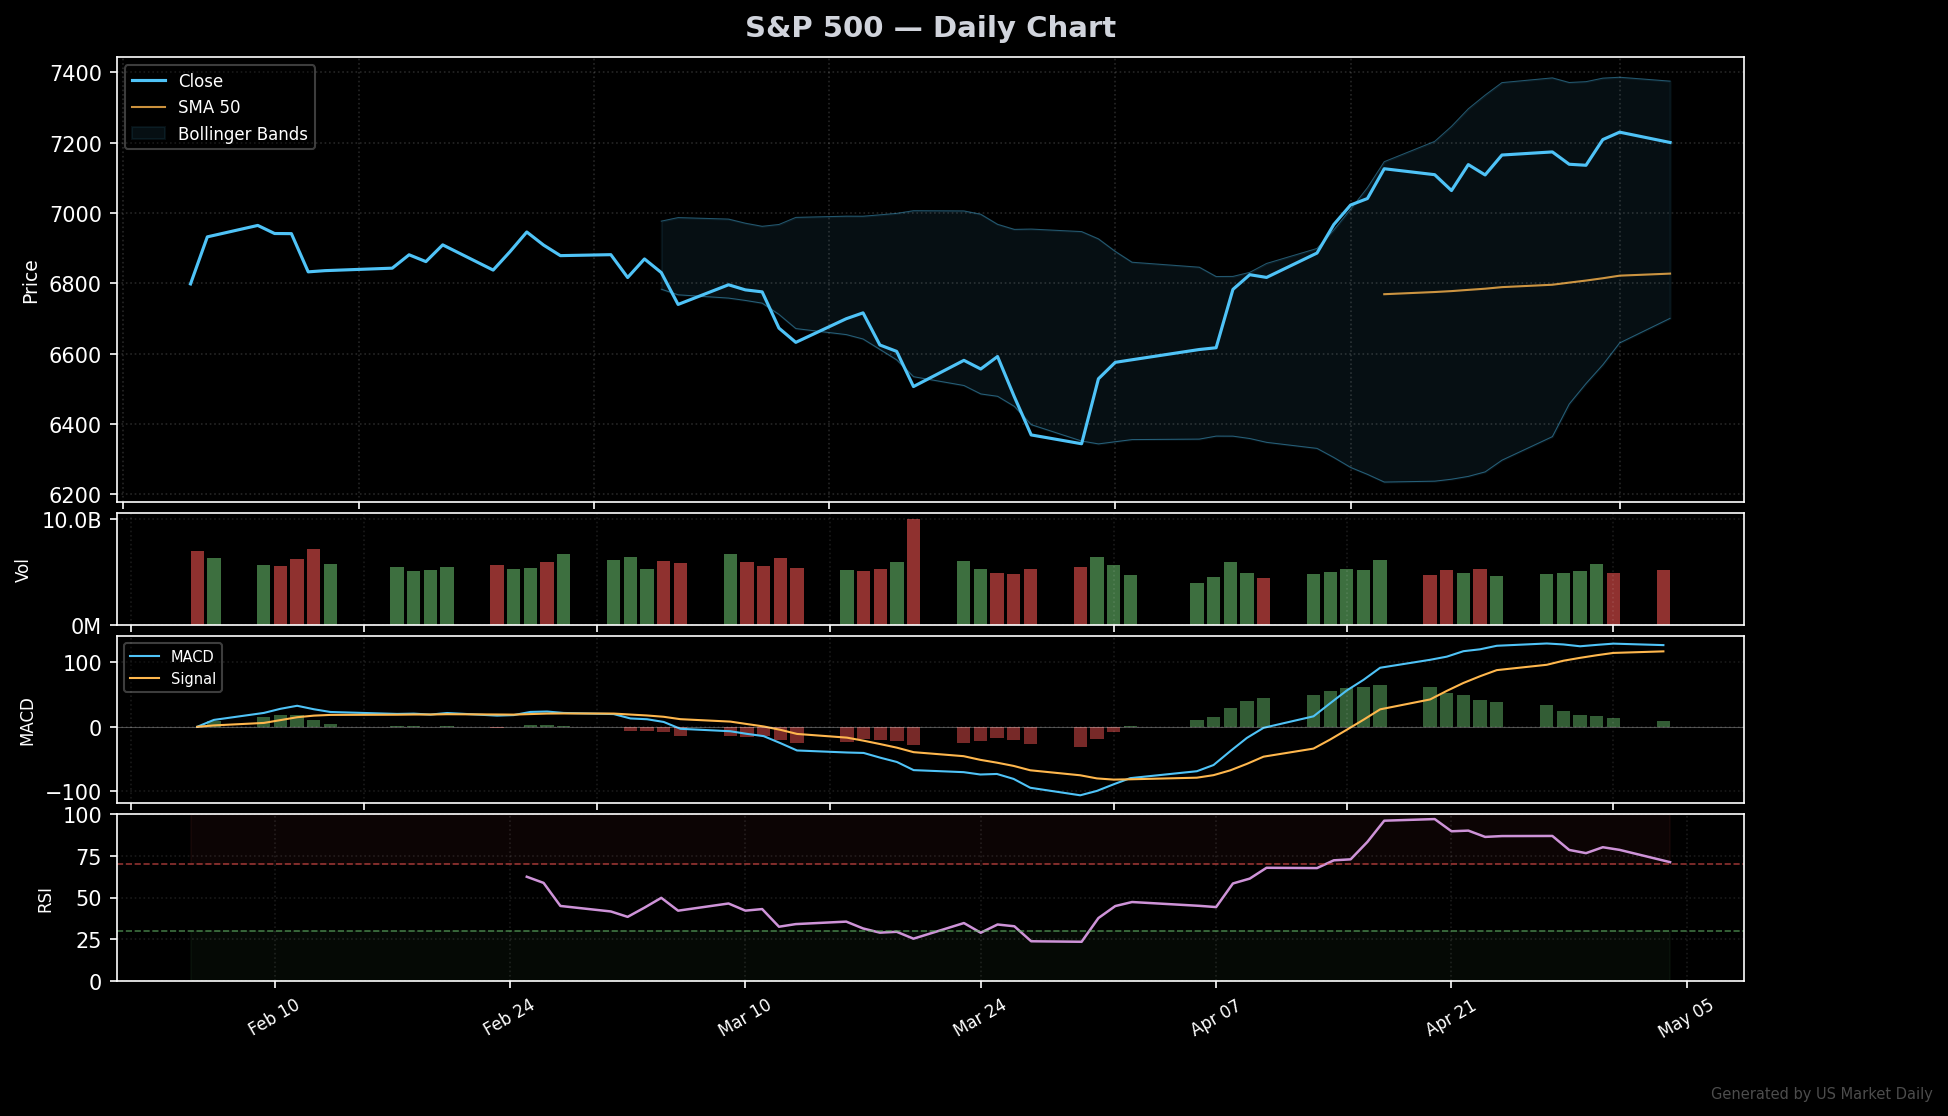
Today’s Outlook & Key Levels
The market outlook is precariously balanced on the outcome of the FOMC policy release. Technically, the S&P 500 faces immediate resistance at 5,310, a level that has served as a psychological ceiling throughout the second quarter. Conversely, support sits firmly at the 5,200 handle; a break below this level would likely trigger a wave of automated stop-loss selling, potentially pushing the index toward its 50-day moving average. The Nasdaq remains in a defined uptrend, but its dependence on a handful of tech names creates a fragility that warrants caution. We view the Russell 2000’s current range of 2,050 to 2,120 as the most important gauge of market health; if it fails to breach the upper bound on strong volume, the broader bull case is severely compromised.
Our positioning guidance remains slightly underweight on energy and defensive staples, as these sectors appear over-leveraged to legacy macro assumptions that are being challenged by the current bond market stability. We are overweighting technology and select industrials, as these segments have shown the greatest resilience during periods of yield-curve stagnation. The bull case hinges on a “dovish hold” scenario where the Fed acknowledges cooling labor market conditions without explicitly committing to further rate hikes, which would likely propel the S&P 500 toward 5,350.
The bear case is contingent on a sticky inflation narrative, where the Fed signals that the recent decline in commodities is insufficient to warrant a pivot. If the VIX breaks above 20 today in response to the press conference, we anticipate a sharp drawdown across all indices. It is worth noting that per our data methodology, the institutional long position is currently crowded; any disappointment in the dot plot or forward guidance could lead to rapid deleveraging. This analysis is for informational purposes and does not constitute investment advice; we advise clients to stress-test their portfolios against a 3% decline in tech-sector pricing.
The overlooked signal is the current tightness in the credit spread, which is not currently reflecting the hawkish rhetoric coming from the regional Fed banks. As the Fed balances between preventing an inflationary rebound and avoiding a hard landing, the volatility of the policy communication will likely exceed the volatility of the underlying spot prices. We expect a breakout in one direction by the close of business, fueled by a high-frequency trading response to the FOMC’s verbatim statement.
Watch: The 14:00 ET FOMC statement release for specific language regarding “data dependency.”
Key level: 5,200 on the S&P 500; a daily close below this level shifts the medium-term trend to bearish.
Trigger: If the DXY surges above 99.5, look for immediate selling pressure in emerging markets and high-yield credit.


