
Market Analysis
Quick answer: Planet Labs PBC (PL) jumped 16.83% to $35.88 as investors seized on margin expansion driven by revenue mix shifts and automation improvements, according to Zacks. The satellite imaging company traded 1.84x average volume at 25.7 million shares, suggesting institutional participation beyond retail momentum.
Planet Labs PBC (PL) jumped 16.83% to $35.88 as investors seized on margin expansion driven by revenue mix shifts and automation improvements, according to Zacks. The satellite imaging company traded 1.84x average volume at 25.7 million shares, suggesting institutional participation beyond retail momentum.


Earnings Catalyst Drives Satellite Stock Rally
According to the Zacks report “Planet Labs Margins Expand on Revenue Mix Shift, Automation?”, the company is benefiting from higher-margin data analytics services gaining ground over raw satellite imagery sales. The automation component centers on AI-powered image processing and automated delivery systems that compress costs while expanding margins.
This operational leverage narrative resonates in a market where profitability timelines carry more weight than pure revenue growth. The company’s latest earnings or guidance appears to have highlighted operational metrics Wall Street hadn’t fully recognized.
Space Sector Momentum Provides Tailwind
The stock isn’t moving alone. Applied Optoelectronics (AAOI) climbed 20.34%, SBA Communications (SBAC) rose 18.93%, and Intuitive Machines (LUNR) gained 18.53%. This sector rotation into space plays signals institutional positioning for the next phase of commercial space buildout.
The risk: when multiple niche-sector stocks all jump 15%+ simultaneously, it has at times reflects algorithmic or thematic buying that reverses just as quickly. PL’s volume profile suggests conviction, but the broader space rally appears less discriminating.
Company Context: From Startup to Scale
The company operates the world’s largest Earth-imaging satellite constellation, serving agriculture, government, and commercial customers with daily global coverage. Since its 2021 SPAC debut, management has worked to prove unit economics can support the massive infrastructure investment required to maintain and expand the satellite fleet.
Technical Setup Points to More Upside
PL’s breakout above $35 cleared key resistance that capped the stock since early 2024. The 922 million in dollar volume represents serious institutional participation—this doesn’t look like a short squeeze. If the margin story holds through the next earnings call, the stock may test 52-week highs near $42.
The broader backdrop helps: 10-year yields fell 14 basis points to 4.31% while the VIX dropped 2.73% to 23.87. Declining yields benefit growth stocks by making future cash flows more valuable today—crucial for a capital-intensive business still scaling toward profitability.
What to Watch Next
The test comes in upcoming sessions. Watch whether PL holds above $34.50—losing that level would suggest today’s move was more hype than substance. Key catalyst: specific margin guidance on the next earnings call could extend this rally. Vague management commentary about automation benefits invites profit-taking.
The level to monitor is $42, representing the stock’s prior high. Breaking above that with volume signals the market believes this margin expansion is structural rather than cyclical. If volume dries up above $36, expect a classic “buy the rumor, sell the news” reversal.
Watch the broader space sector correlation. If LUNR, AAOI, and other space plays roll over, PL will likely follow regardless of individual fundamentals—sector momentum cuts both ways.
This analysis is for informational purposes only and should not be considered personalized investment advice. Trading involves substantial risk of loss and may not be suitable for all investors.
Expectation vs. Reaction
Use this when the tape looks different from what options or positioning implied.
Engine verdict: Unresolved — Expected/actual gap unavailable, so treat follow-through as unresolved until more tape develops.
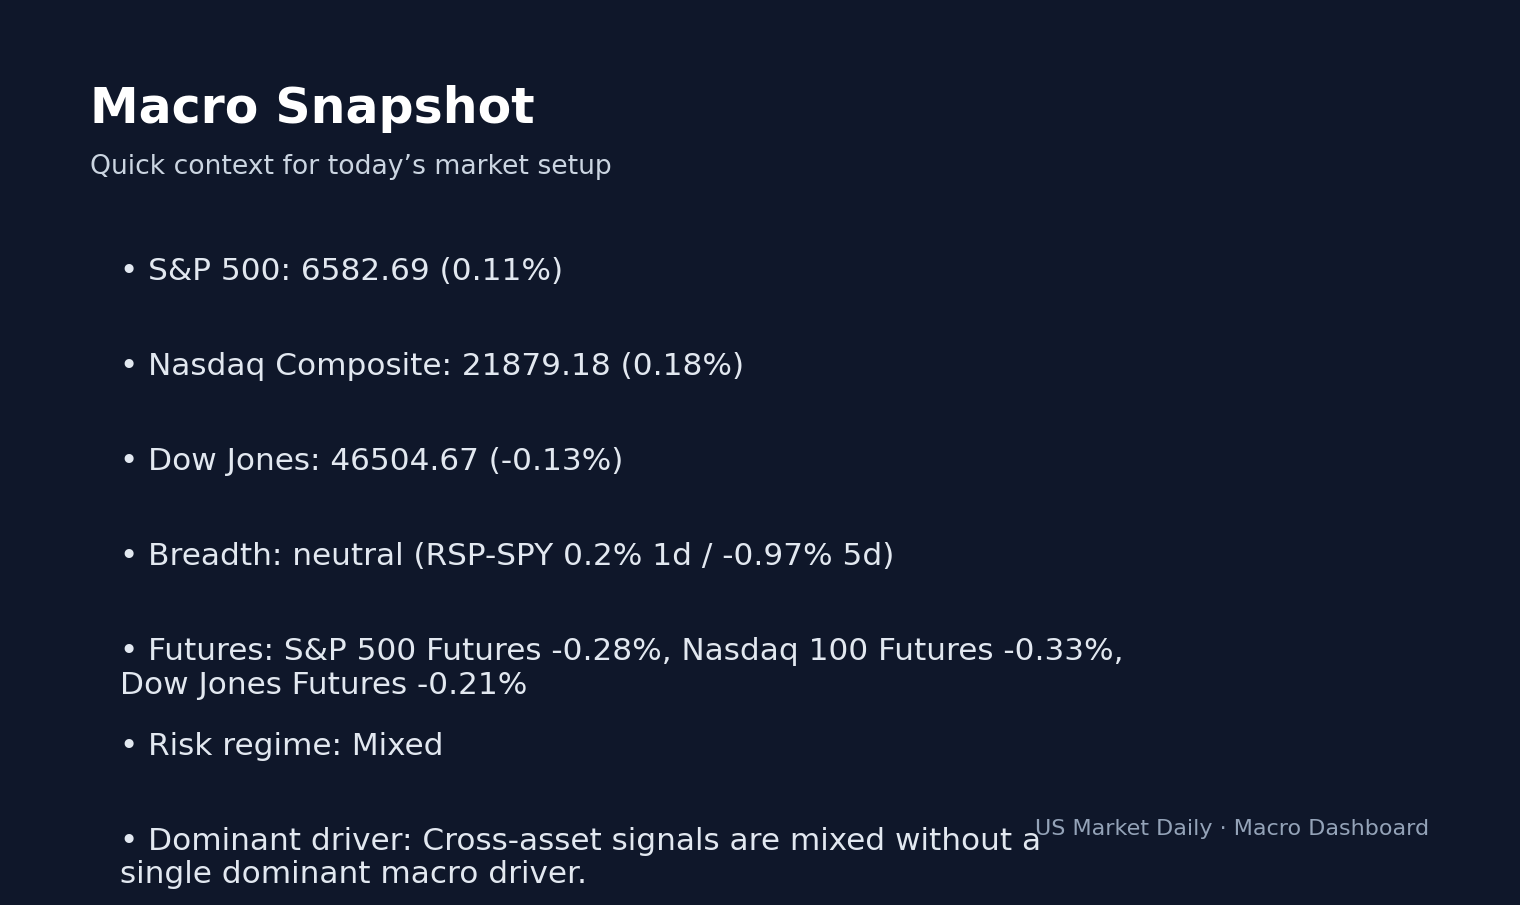
Breadth / sector spread: breadth 1d 0.2 | breadth 5d -0.97 | ETF spread vs SPY None | basket spread vs SPY None.
Volume / follow-through: concentration None | state developing.
What confirms the reaction
- Related ETF / market-gauge basket is moving +0.47% on average.
What breaks the reaction
- Five-day breadth spread is -0.97, so participation still looks narrow.
Closest Historical Echo
A quick analog check so readers can compare this setup with prior commodity-shock tapes.
Closest echo: prior commodity-shock sessions with energy leadership and transport pressure.
What tended to matter then: energy leadership tends to confirm only when services and majors participate together while fuel-sensitive groups lag
What is different now: This time actual price action is landing close to implied expectations, so confirmation breadth matters more than headline size.
Recent internal echoes
- Why Global Markets Are Moving Tonight: Gold Crashes -2.8% as Oil Surges +11.4% in Volatile
- Why Global Markets Are Moving Tonight: Gold Crashes -2.8% as Oil Surges +11.4% in Volatile
- Why Global Markets Are Moving Tonight: Gold Crashes -2.8% as Oil Surges +11.4% in Volatile
Historical watchpoints for this setup
- XLE relative strength vs SPY
- USO/crude follow-through after the open
- airlines and transports staying under pressure
- overnight crude trade
The Market Translation: Oil Shock
A tighter execution map for the theme behind today’s move.
What this means: Crude is up +11.41% and energy equities are confirming with XLE +0.47%.
What’s already priced in: options are implying roughly 1.75% moves around key events; META is carrying one of the largest event bars in the tape
Reaction quality: Mixed confirmation
Stocks tied to this theme
- OXY — direct winner. higher-beta crude exposure makes it more sensitive to oil spikes
- XOM — core major. integrated oil major that usually anchors the theme for institutions
- CVX — core major. large-cap energy benchmark with strong balance-sheet sensitivity to crude
- SLB — second-order beneficiary. services leverage improves if stronger crude supports upstream activity
- VLO — refining angle. refining economics can matter if the move broadens beyond upstream producers
Theme map
Theme map split into direct winners, second-order confirmations, crowded names, lagging names, and false friends to avoid ticker dumping.
Direct winners
- OXY — direct winner. higher-beta crude exposure makes it more sensitive to oil spikes
- XOM — core major. integrated oil major that usually anchors the theme for institutions
- CVX — core major. large-cap energy benchmark with strong balance-sheet sensitivity to crude
- SLB — second-order beneficiary. services leverage improves if stronger crude supports upstream activity
Second-order beneficiaries
- VLO — refining angle. refining economics can matter if the move broadens beyond upstream producers
Crowded names
- OXY — direct winner. higher-beta crude exposure makes it more sensitive to oil spikes
- XOM — core major. integrated oil major that usually anchors the theme for institutions
False friends
- DAL — headline loser. airlines are sensitive to fuel, but they often overreact to the first crude headline
- MPC — refining nuance. refiners can trade differently from upstream names when crude spikes squeeze margins
ETFs and market gauges to watch
- XLE — sector ETF. cleanest broad read on energy equity follow-through Recent action: $59.25 | +0.47%.
- USO — commodity proxy. tracks the crude tape more directly than equities
- JETS — downstream loser. airlines can highlight whether fuel-price pressure is broadening
What confirms the move
- XLE continues to outperform the S&P 500 rather than giving back the open
- USO or crude futures hold gains while airline and transport names stay under pressure
- services names like SLB join the move, showing the theme is broadening beyond majors
What would prove it wrong
- Crude fades quickly while energy equities lose relative strength by midday
- Airline and transport underperformance reverses even with oil elevated
Look smart tomorrow
- overnight crude trade
- XLE vs SPY relative strength
- airline/transport follow-through
Playbook Memory
Internal reference notes from similar setups already covered on the site.
What this setup has looked like on this site: Oil Shock playbook memory from 44 site examples | common sections: Recent internal echoes, What confirms the reaction, What breaks the reaction
Memory strength: strong | Tracked examples: 44 | Rewrite candidates: 0 | Refresh candidates: 0
Sections that usually mattered
- Recent internal echoes
- What confirms the reaction
- What breaks the reaction
- Historical watchpoints for this setup
Checks this setup usually needs
- Usual confirmation focus: XLE continues to outperform the S&P 500 rather than giving back the open
- Usual failure mode: Crude fades quickly while energy equities lose relative strength by midday
- Current follow-through state: developing
Recent internal echoes
- Why Global Markets Are Moving Tonight: Gold Crashes 2.8% as Oil Surges 11.4% in Volatile Overnight Session
- Why Global Markets Are Moving Tonight: Gold Crashes -2.8% as Oil Surges +11.4% in Volatile Asian Session
- Why Global Markets Are Moving Tonight: Gold Crashes -2.8% as Oil Surges +11.4% in Volatile Asian Session
- Why Global Markets Are Moving Tonight: Gold Crashes -2.8% as Oil Surges +11.4% in Volatile Asian Session
Tomorrow’s Playbook
Keep this one open if you want the forward-looking levels, confirms, and invalidation checklist.
Summary: Tomorrow's playbook for Oil Shock: Crude is up +11.41% and energy equities are confirming with XLE +0.47%. The opening check is whether confirmation broadens fast enough to overcome the risk that the headline fades once cash-session liquidity resets the tape.
Base case: treat the setup as developing and let the first hour decide whether the theme broadens or stalls.
Risk regime: mixed | Breadth: neutral | Follow-through: developing
Opening 30-Minute Checks
- Watch whether oil shock leaders hold the opening range in the first 30 minutes.
- Cross-check the opening range and whether leadership broadens against breadth (neutral) rather than the index alone.
- Treat an unresolved reaction with developing follow-through as tentative until volume and ETFs confirm.
Key Levels to Watch
- the opening range and whether leadership broadens
- 10Y yield around 4.31% as the rates cross-check.
- VIX around 23.87 as the volatility confirmation level.
If / Then Framework
- If xle continues to outperform the s&p 500 rather than giving back the open, the market can keep leaning into oil shock.
- If crude fades quickly while energy equities lose relative strength by midday, downgrade the move to a headline reaction rather than a durable regime shift.
- If options are implying roughly 1.75% moves around key events; META is carrying one of the largest event bars in the tape, focus on laggards and breadth instead of chasing the first winner.
What Confirms the Move
- XLE continues to outperform the S&P 500 rather than giving back the open
- USO or crude futures hold gains while airline and transport names stay under pressure
- Related ETF / market-gauge basket is moving +0.47% on average.
What Invalidates the Move
- Crude fades quickly while energy equities lose relative strength by midday
- Airline and transport underperformance reverses even with oil elevated
- Five-day breadth spread is -0.97, so participation still looks narrow.
Next-Session Checklist
- overnight crude trade
- XLE vs SPY relative strength
- airline/transport follow-through
- XLE relative strength vs SPY
- USO/crude follow-through after the open
Options Interpretation / Sector / Industry Dispersion / Data Freshness
Supporting signals for readers who want the deeper tape, options, and breadth context.
Options Interpretation
Summary: implied moves are muted; IV premium is cheap; skew is balanced; term structure is flat; OI positioning looks upside-chasing.
Regimes: implied move muted | IV premium cheap | skew balanced | OI positioning upside-chasing | term structure flat.
Sector / Industry Dispersion
Moderate Dispersion with mixed leadership breadth, selective participation under the surface, and a leader/laggard spread of 3.11 percentage points.
Rotation / participation profile
- Rotation state: balanced rotation
- Style tilt: style balance
- Cyclicals vs defensives: -0.41 pts
- Growth vs value: +0.40 pts
Dispersion leaders
- XLRE: +1.61%
- XLK: +0.80%
- XLP: +0.53%
Dispersion laggards
- XLI: -0.40%
- XLV: -0.62%
- XLY: -1.50%
Data Freshness
Data is fresh for the premarket tape with 2/6 source buckets populated; session alignment is aligned and intraday readiness is ready.
Session / freshness profile
- Market phase: premarket
- Expected window: premarket
- Session alignment: aligned
- Intraday readiness: ready
- Overnight carry: acceptable
Driver Profile Monitor
- AAPL: drivers iPhone replacement cycle, China demand; watch services growth, Greater China revenue
- MSFT: drivers Azure growth, AI monetization; watch Azure constant-currency growth, commercial bookings
- GOOGL: drivers search ad resilience, cloud profitability; watch Google Cloud margin, search revenue growth
- AMZN: drivers AWS demand, retail margin expansion; watch AWS growth, North America margin
Three Numbers That Matter
A compact frame for the three readings most worth carrying into the next session.
Three Numbers That Matter
- 10Y yield: 4.31% — Higher yields usually tighten the leash on long-duration growth and small-cap risk appetite.
- VIX: 23.87 — Volatility tells you whether the tape is confirming risk-taking or fading it.
- WTI crude: $111.54 — Crude often decides whether the theme stays isolated or spills into broader inflation and risk sentiment.
What’s Different This Time
- This time the market is dealing with a Oil Shock setup rather than a generic macro headline.
Data sources: Yahoo Finance · Zacks · Simply Wall St. · Insider Monkey · Motley Fool
📚 Related Articles
- Why Stocks Are Moving Today: 🚨 BREAKING: Oil Shock Drives S&P 500 Down 0.84% as Geopolitical Tensions Escalate
- Why Global Markets Are Moving Tonight: Gold Drops 2.8% to $4,651 as Oil Surges 11.4% in Sharp Cross-Asset Move
- Why Global Markets Are Moving Tonight: Gold Plunges 2.8% as Oil Surges 11.4%
Explore the Macro & Risk Regime Playbook
This article fits into our Macro & Risk Regime topic cluster and is meant to serve why stock is moving.
Evergreen angles to build next
- How the Dollar, Oil, and Credit Spreads Shape Equity Risk — Connect cross-asset signals to equity positioning and sector pressure.
- What Risk-On and Risk-Off Really Look Like — Define risk regimes using yields, breadth, credit, and volatility instead of vague headlines.
- How to Read an Earnings Implied Move — Show how options pricing frames expectations into an earnings event.
Cluster-adjacent reads
Macro Risk Regime Playbook
A hub for reading how the dollar, oil, credit, and safe-haven flows reshape equity risk.
Suggested reading path
- Start with risk-on vs risk-off
- Then connect dollar/oil/credit moves
- Use daily event notes to see regime shifts as they happen
Core evergreen guides in this hub
- How the Dollar, Oil, and Credit Spreads Shape Equity Risk — Connect cross-asset signals to equity positioning and sector pressure.
- What Risk-On and Risk-Off Really Look Like — Define risk regimes using yields, breadth, credit, and volatility instead of vague headlines.
Glossary anchors: risk-off, credit spreads, cross-asset, safe haven
The information presented here is for general informational purposes only and should not be considered as personalized investment advice. All investing involves risk.


